

Bear Interpretations Are Working

Patterns tend to fail if they are against the primary trend.
Failed patterns can be as profitable, if not more so, than successful ones.
For the first, bearish setups fail in bull markets and vice versa. Back in October 2022 and again in October 2023, there were patterns that would have unleashed incredible bearish energy had they completed. They did not and it went from being a major breakdown to a major support.
As for the second, failures can be as described above or the fakeout moves that suck in technical traders and then reverse, creating the trap that provides energy for the opposite move.
Here’s a classic one: USDMXN breaking lower in late 2019 as various bearish forces coming into alignment. Then, surprise!
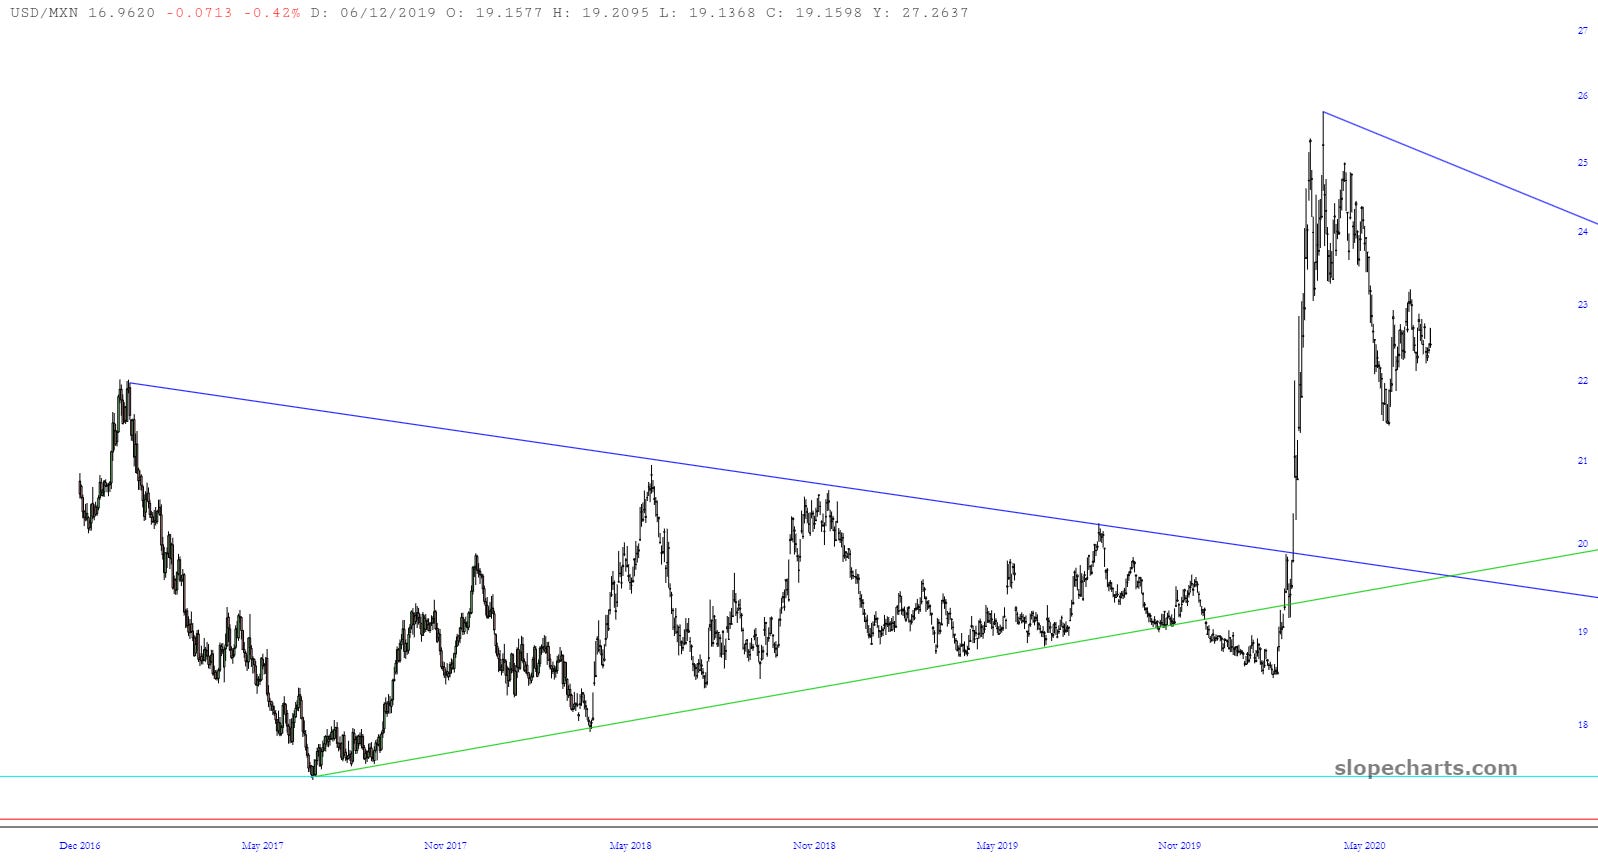
Here’s USDMXN again breaking down and now reversing higher. Could it be a repeat in the making? It still has quite a ways to go before it reverses the picture.

There are always bull and bear interpretations for many patterns. Sometimes the patterns are fairly clear though, and the opposite read requires failure. This sets up a situation where the market “fails” to behave as expected. Those moves tend to be powerful.
On a smaller scale, yesterday I noted crude oil had to hold support around the $84 area or it will test the $81 area. It lost that support and then immediately tested the next support in less than 24 hours.
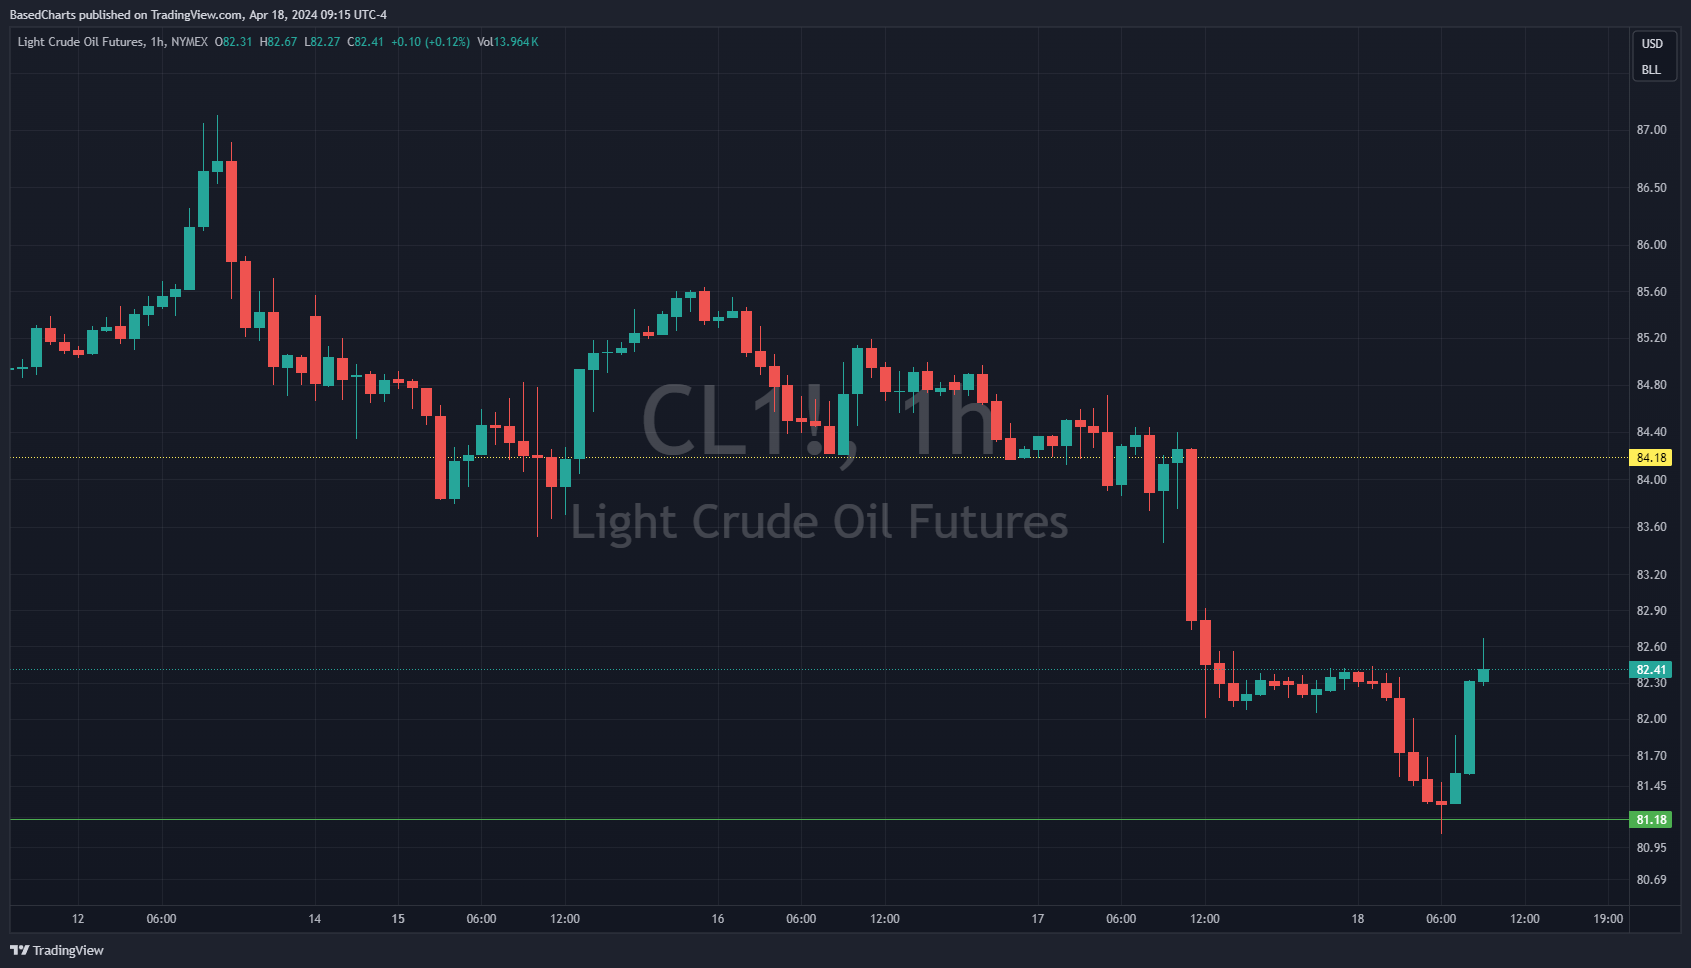
Crude oil is more of an organic, two-way market because central bankers aren’t working to prop up its price.
Crude could still be forming a bullish base here. It won’t be broken unless crude trades below $60 per barrel. Still, yesterday’s move was a fairly bearish breakdown.
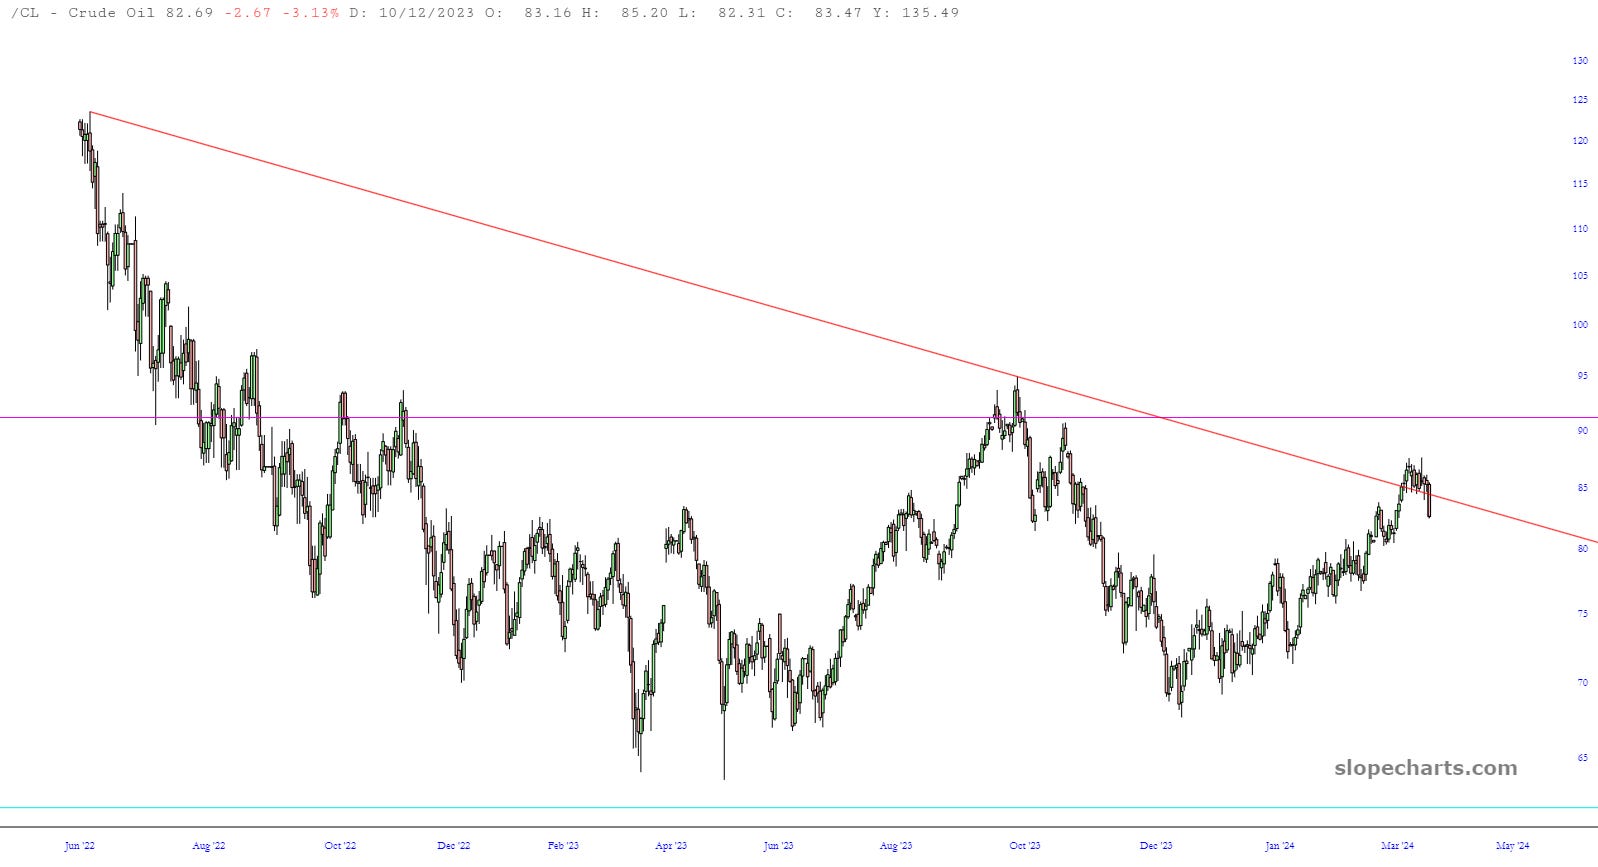
Assets such as gold and USDJPY are moving in a bullish direction, but these have bearish connotations for the stock market. Crude is arguably bearish in either direction for stocks, at least in the short-term. Higher oil guarantees rising consumer prices. Rapidly falling oil, a move like yesterdays continuing for days or weeks, would hint at a rapid economic slowdown.
I posted a bunch of charts in Notes yesterday, as well as this one looking at how quickly a move lower could proceed:

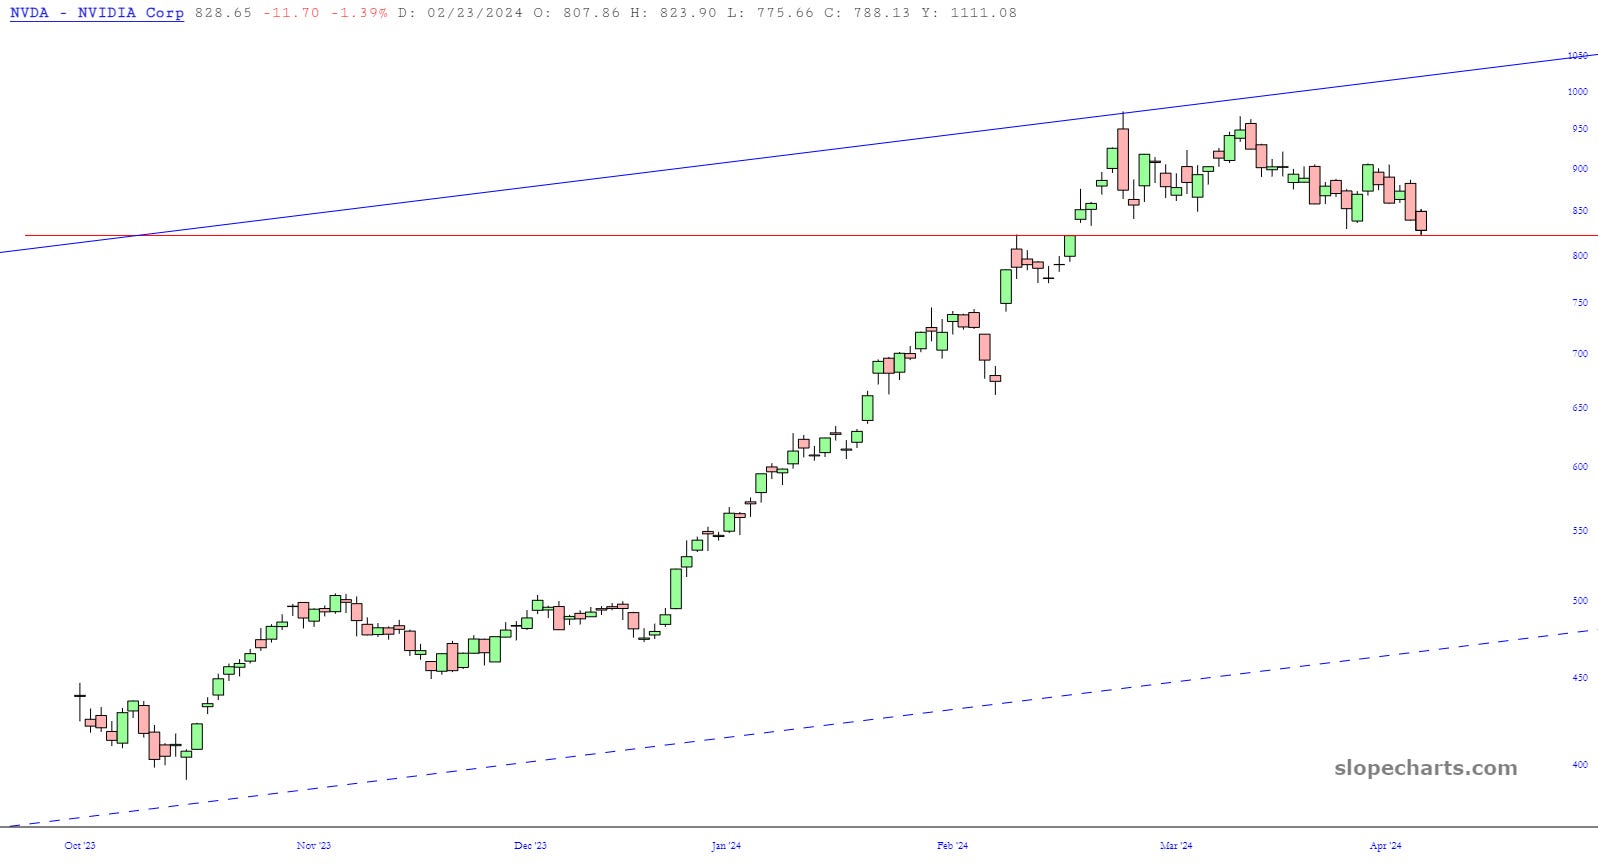
Here is SMH 0.00%↑ coming upon a gap that runs from $206.33 down to $196.54. SMH is at $207.75 as I’m typing. The stock that looks most like SMH is NVDA, because NVDA is the largest component.

NVDA 0.00%↑ filled a different, smaller gap this morning:
In one of my Notes yesterday, I showed a heat map of the market:
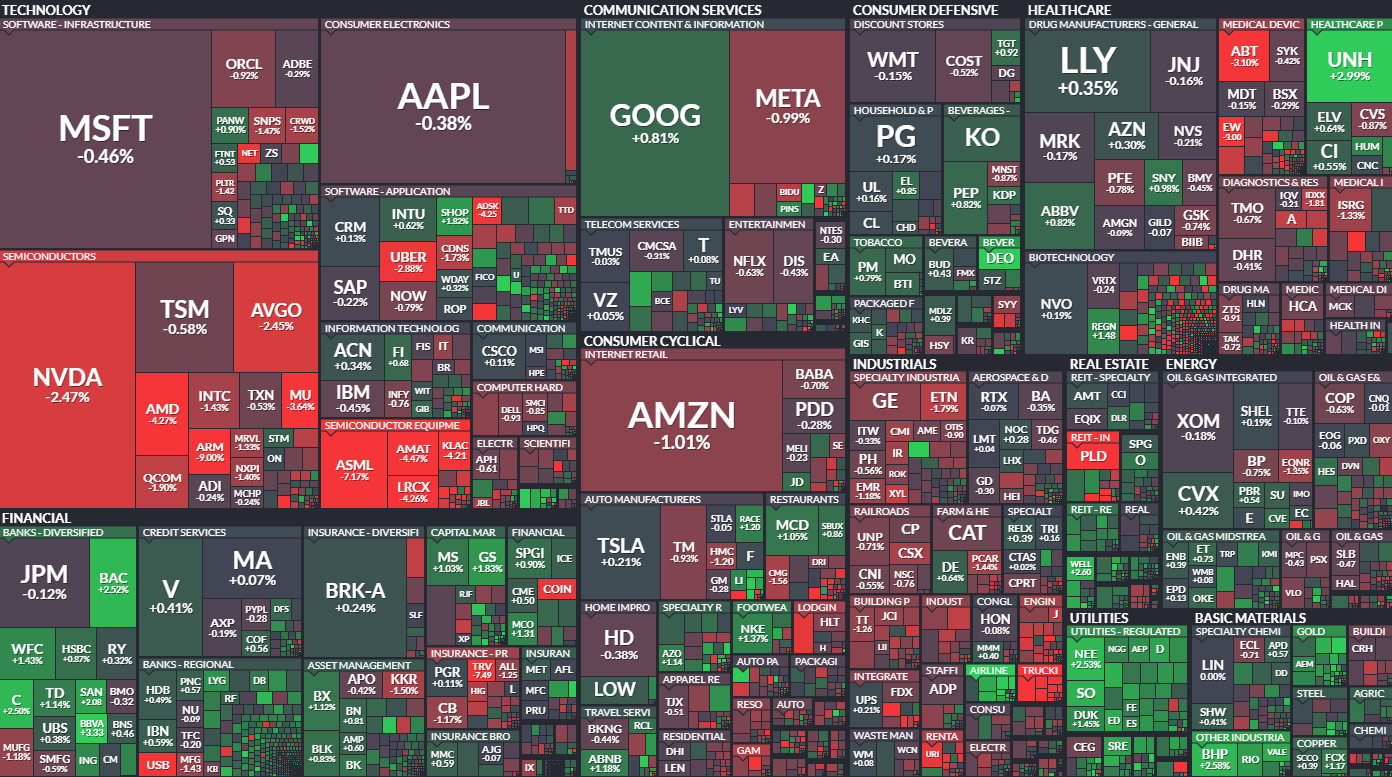
It was a down day mainly because chip stocks fell. One could interpret that bullishly as a concentrated correction, or bearishly since it managed to take the major indexes down on the day by itself.
The market is about to show its hand for the near term.
A bullish rebound in Nvidia and chips probably won’t be a major bullish turn, but it should unleash another rip ramp higher. It would at least open a door for new all-time highs on the S&P 500 and Nasdaq.
A bearish breakdown could become serious fairly quickly. The Russell 2000 Index is down about 10 percent in April and it is red on the year. The DJIA is flirting with going red on the year. Nasdaq and the S&P 500 are propping up the market, themselves propped up by chip stocks and Mag 6 (Tesla out finally?)As I showed in yesterdays “Open Door” post, the rapid rise in stocks this year left them with little support. A retrace all the way back to January levels is quite possible if selling gets going. Maybe the start of something much larger if it unfolds, but we’ll assess that bridge if we come to it.