China Printing At Devaluation Speed
China Printing At Devaluation Speed
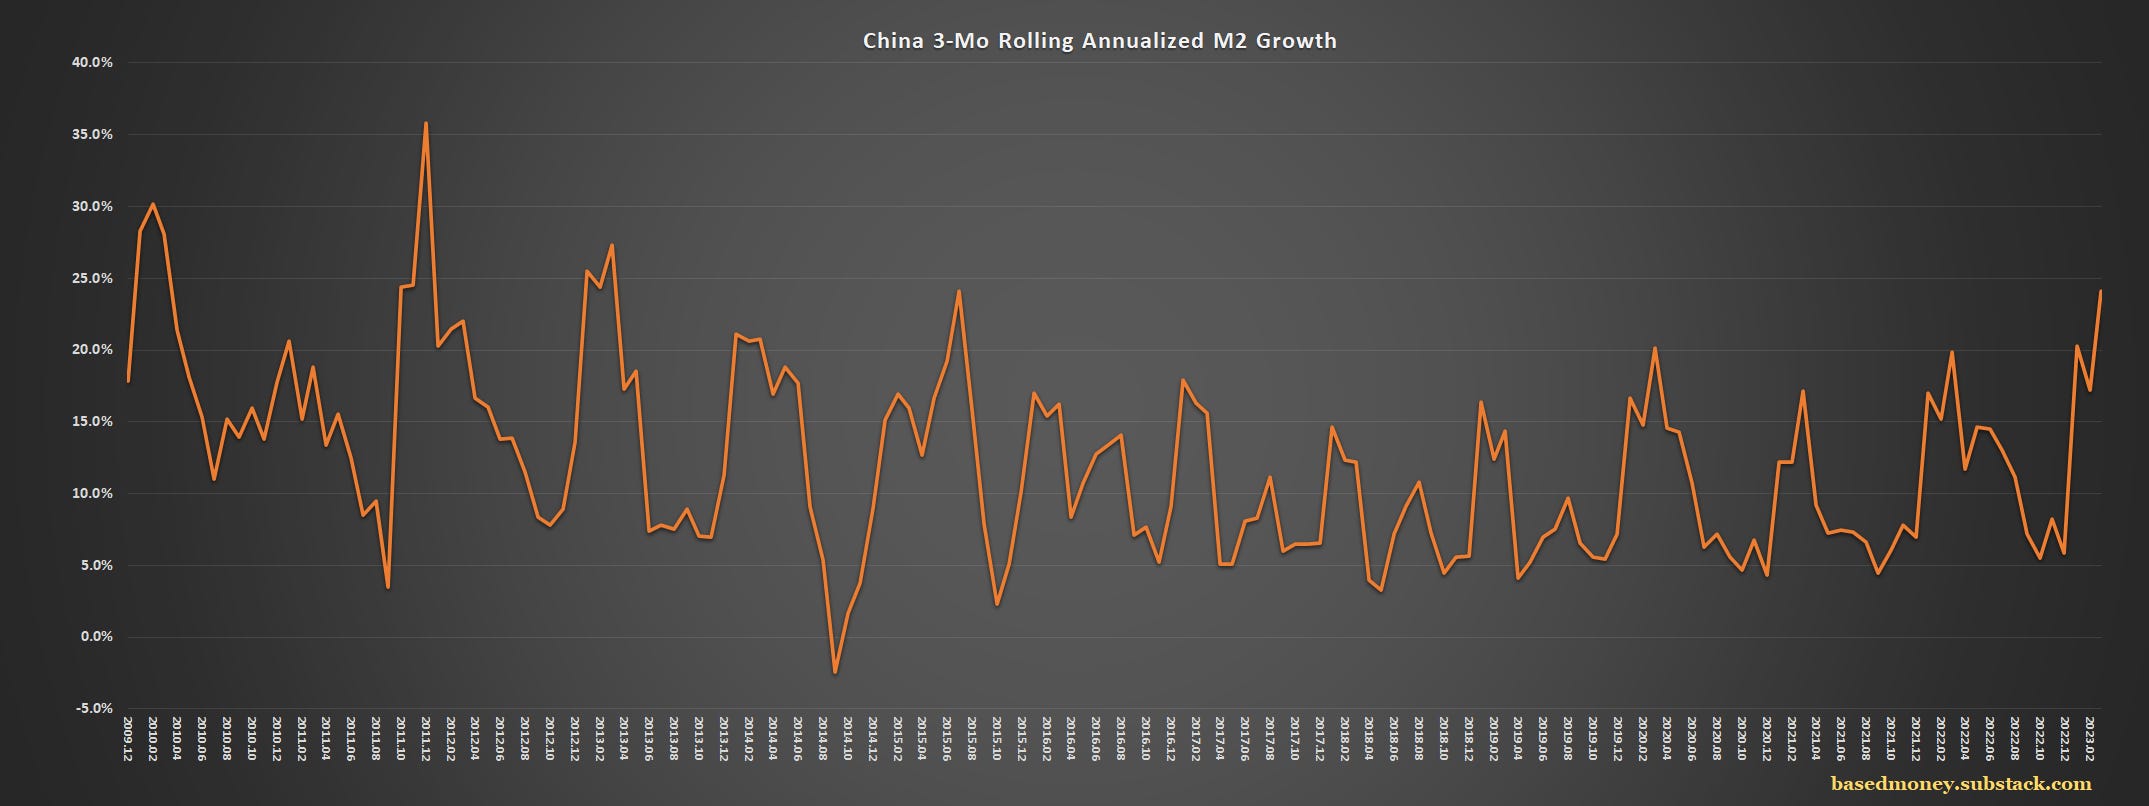
Last time M2 grew this fast was in July 2015, one month before "surprise" yuan depreciation

Most of the charts show the same ongoing trends, but one stands out: the annualized three-month growth rate of M2 money supply growth. It hit 24.1 percent in March. The last time it hit 24.1 percent? July 2015. The “surprise” yuan depreciation was in August 2015 under similar economic circumstances.
M2 is growing 12.8 percent year-on-year. For comparison, the U.S. M2 yoy rate of change is now negative. Back in 2015, China’s M2 was growing 13.3 percent.
This chart is extra large if viewed in a new tab.
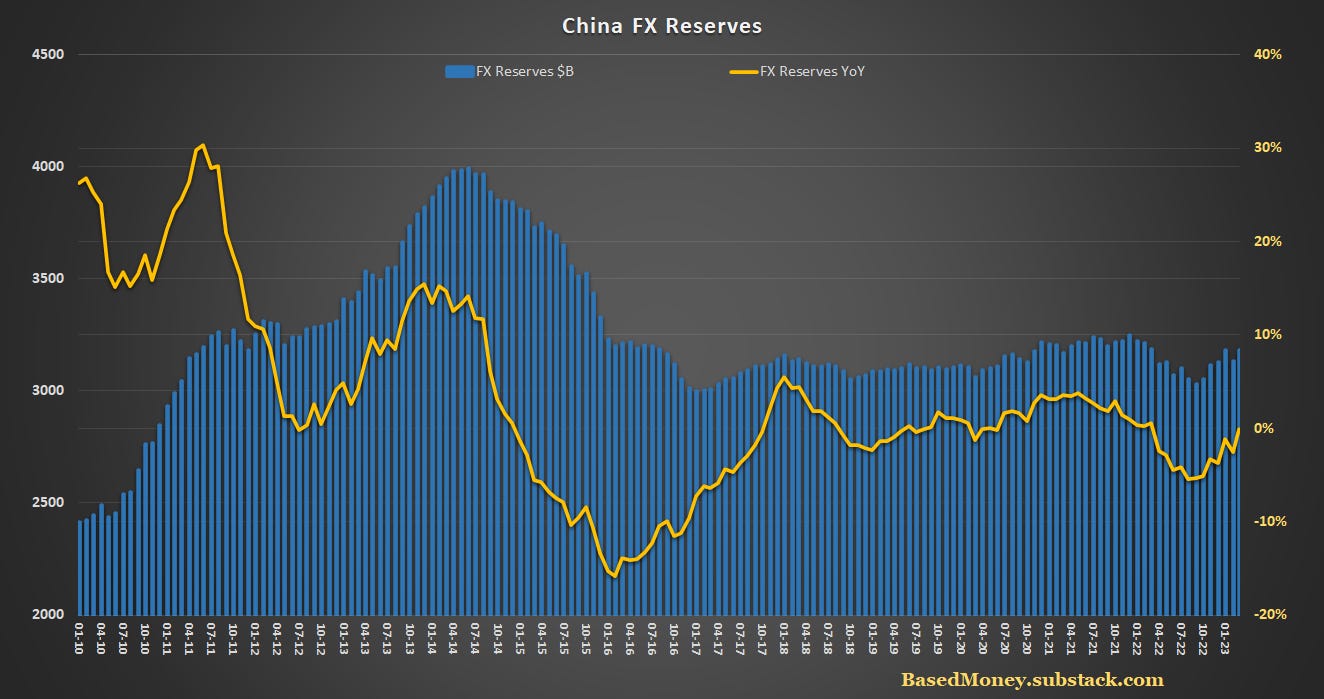
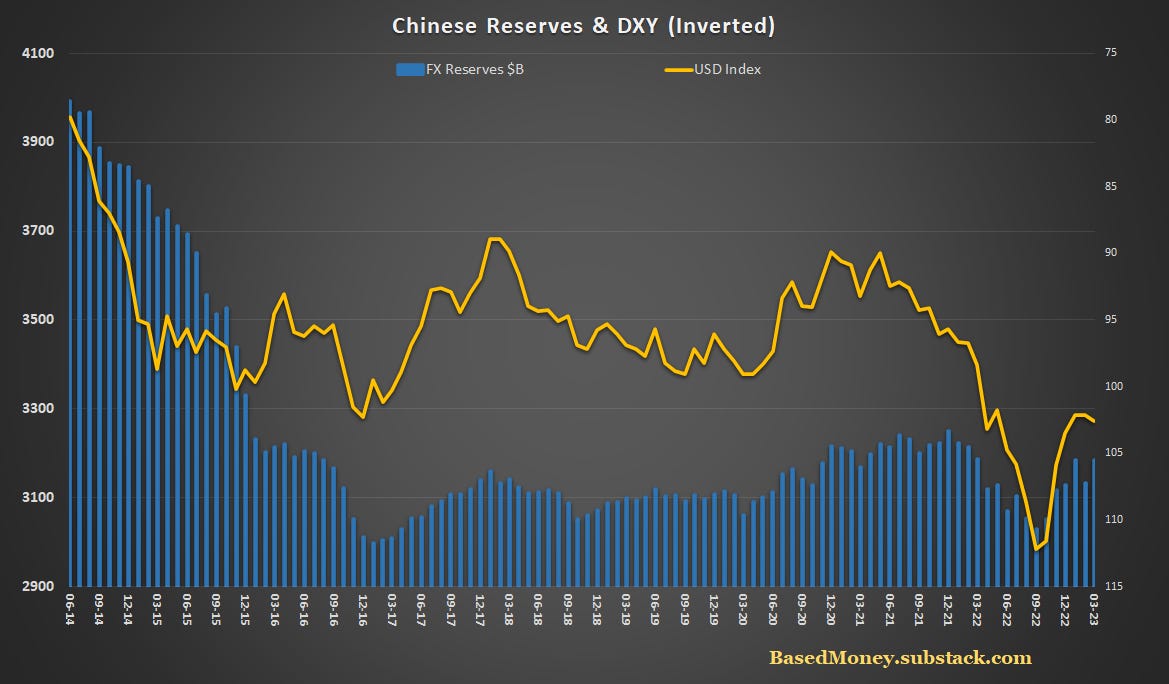
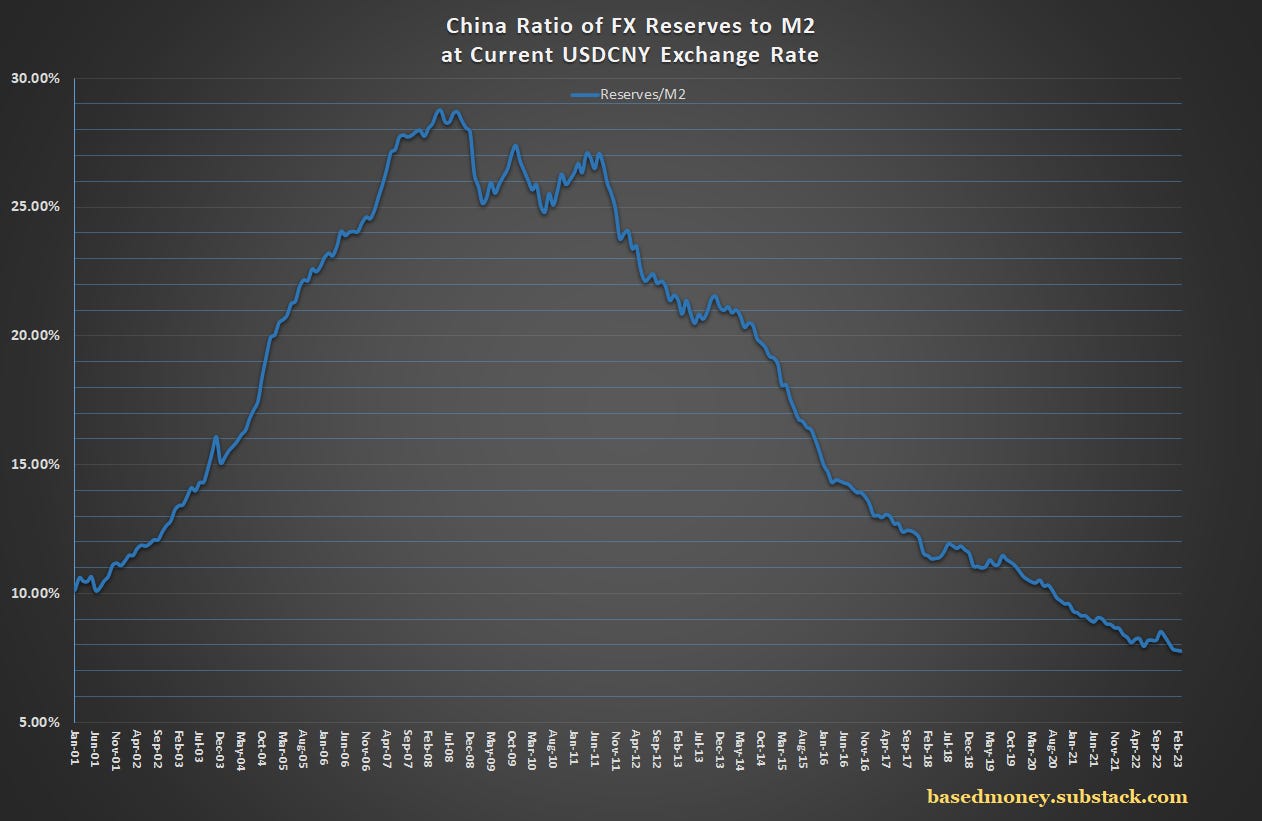
China is printing heavily with its economy in borderline recessionary conditions. Last time, the depreciation occurred with reserves flowing out amidst a U.S. dollar rally. As I point out every time I’m on this subject: the direction of the U.S. dollar is the most important element. If the U.S. dollar weakens into a new bear cycle, it’ll be years before the bill for this money printing comes due.
I have no guess as to today’s CPI number, but if it comes in hot and the dollar starts breaking out again (USDKRW still creeping higher), this is setting up for some major FX volatility here and now.