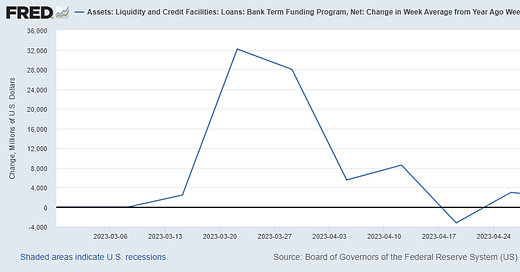
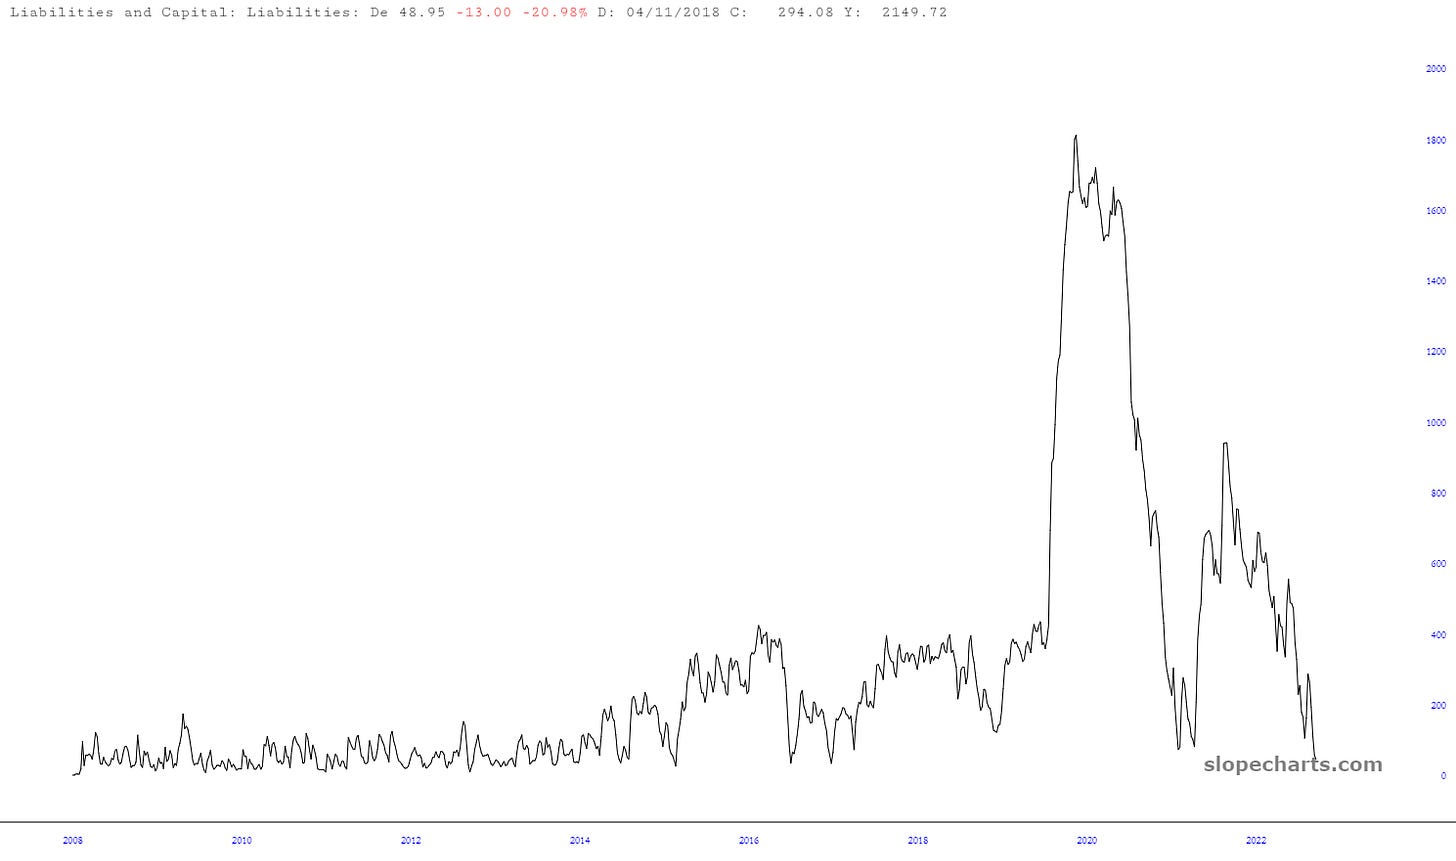
At this point, the Nasdaq is a reverse indicator for the Bank Term Funding Program (BTFP). As you would have correctly guessed, the Fed pumped it again the prior week:
It was the biggest liquidity injection since the week ended on April 12.
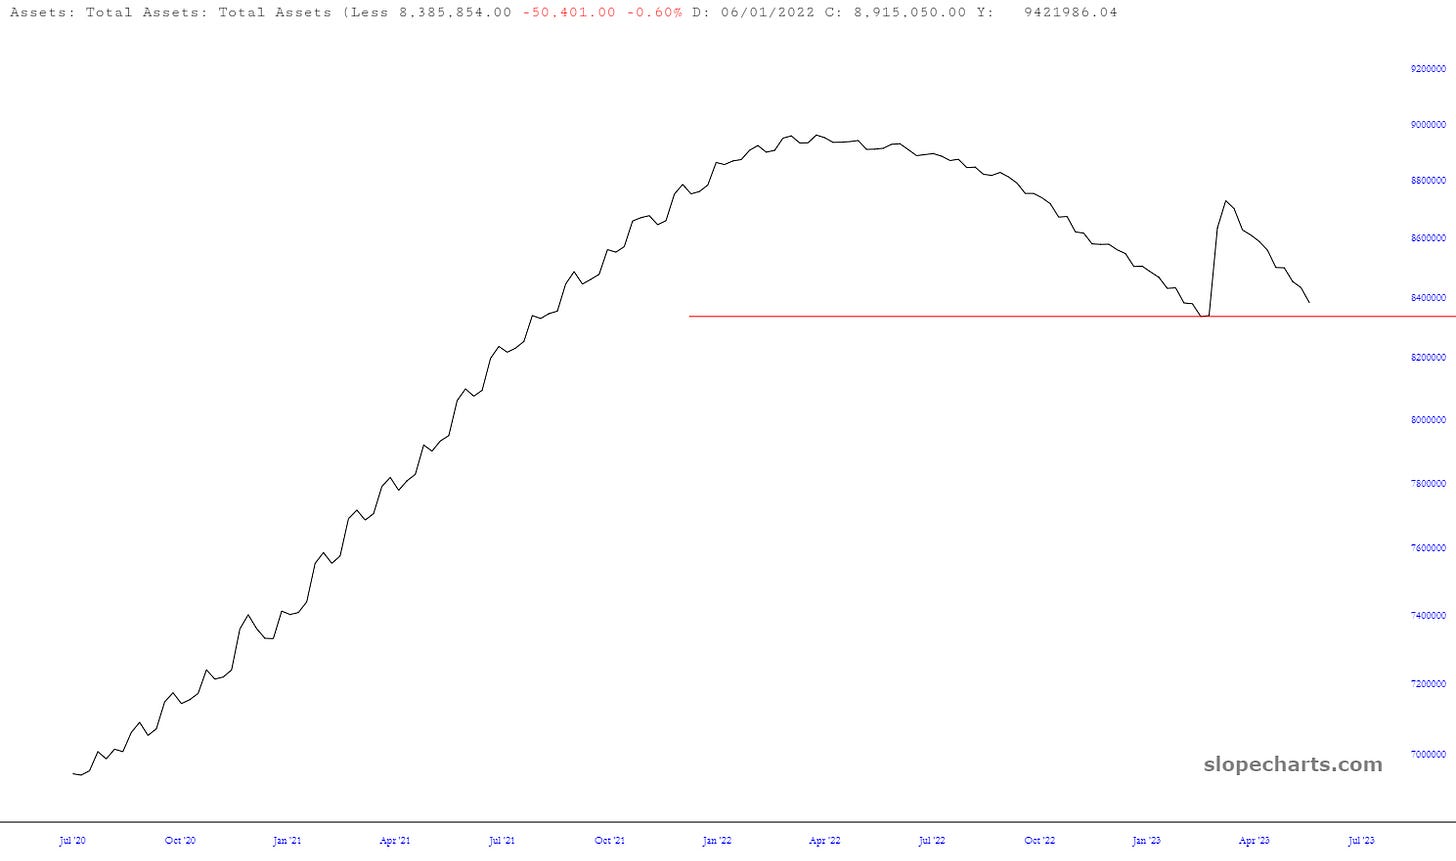
While the Fed in fuel injecting on one side, they’re still dribbling out excess balance sheet liquidity on the other:
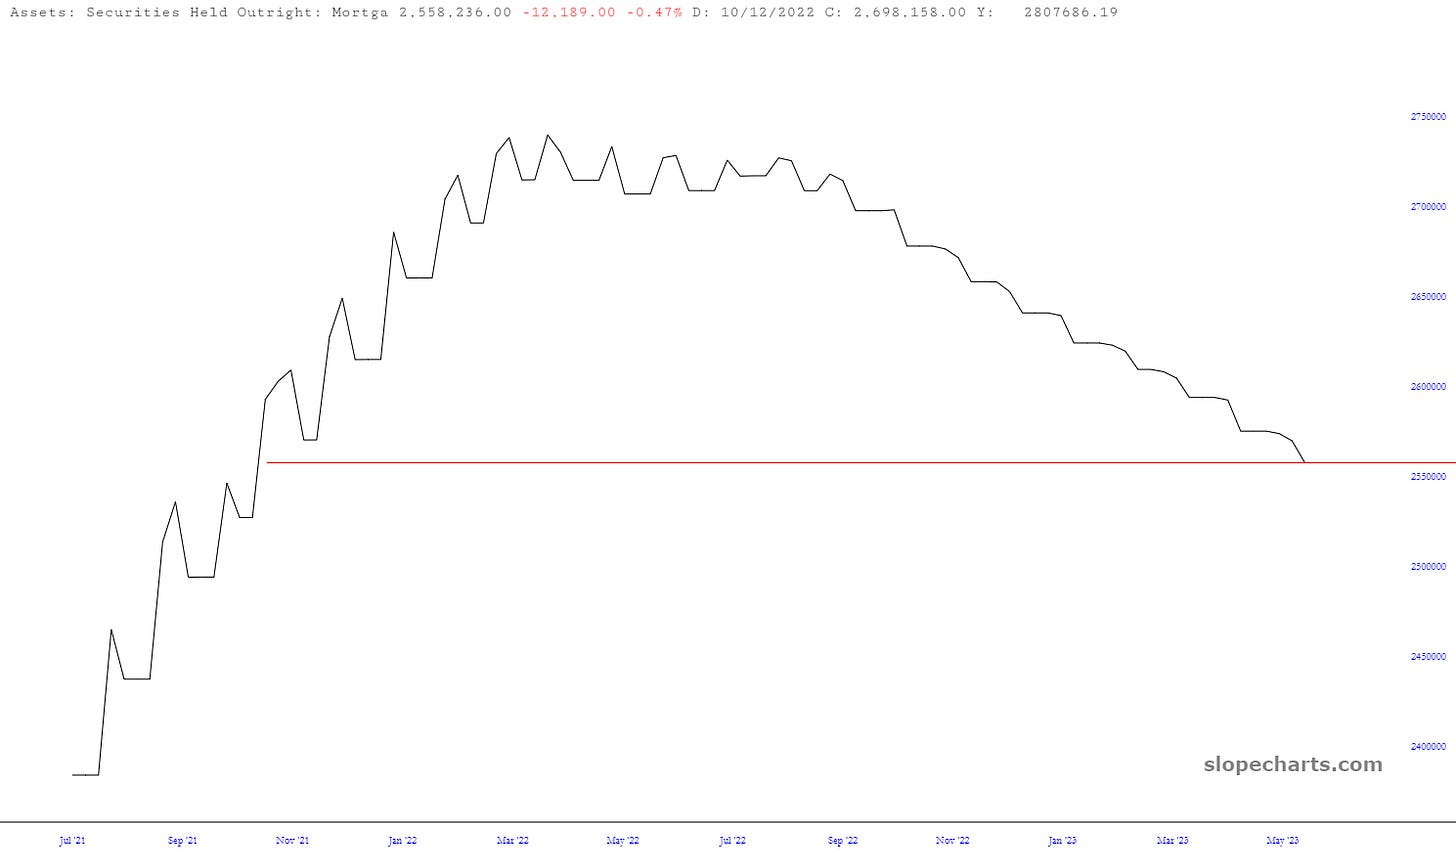
The balance sheet is back to where it was in August 2021, one of the peak periods for the Nasdaq-Russell 2000 ratio. The Fed has reduced mortgage securities back to where they were at the Nasdaq peak in November 2021:
Treasury holdings are down to the June 2021 level:
One of the models that worked for the market in 2022 was to look at liquidity coming in and out of the system. The big liquidity injector this year has been USG’s monster budget deficit. It’s pumping about 7 percent of GDP into the economy over the past year (and real GDP is only growing about 2 percent…). This is the largest deficit outside of a recession* or a government locking down its own economy:
*Unless the deficit is telling us there is a recession that the official data hasn’t picked up on.
However, without QE soaking up Treasuries, new borrowing has to pull capital from somewhere. In 2022, Treasury issuance acted as a liquidity vacuum. The theory says when Treasury balances go up, all else being equal, stocks will face a headwind.
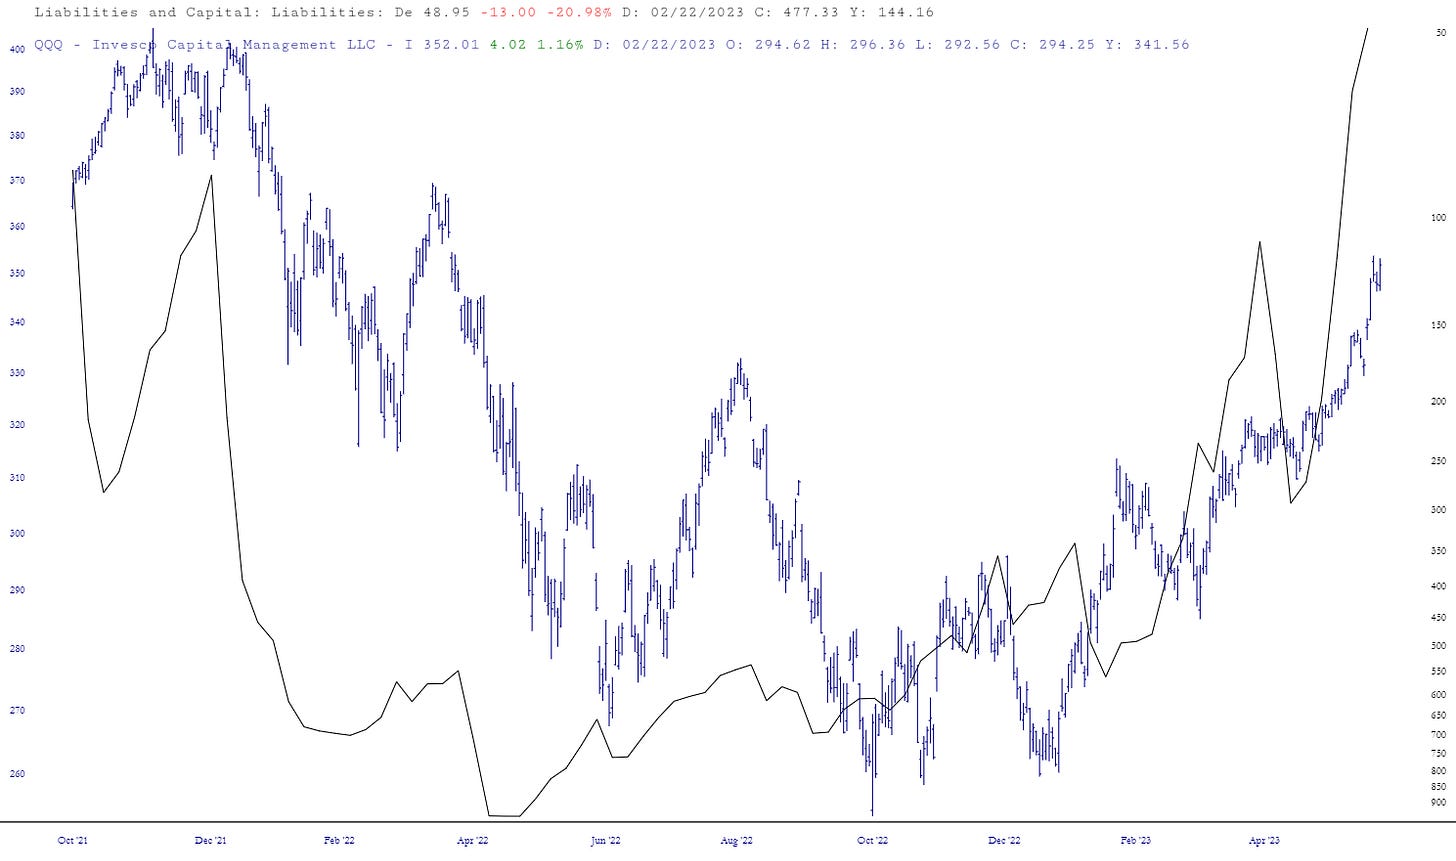
Here’s the Treasury balance at the Fed inverted, versus QQQ 0.00%↑
A rough correlation, but not a tight one.
Aside from this correlation potentially weakening, there’s also $2 trillion in overnight repo that could potentially flow into Treasuries. In that case, the impact on liquidity should be negligible, all else equal.
Pump It Real Good
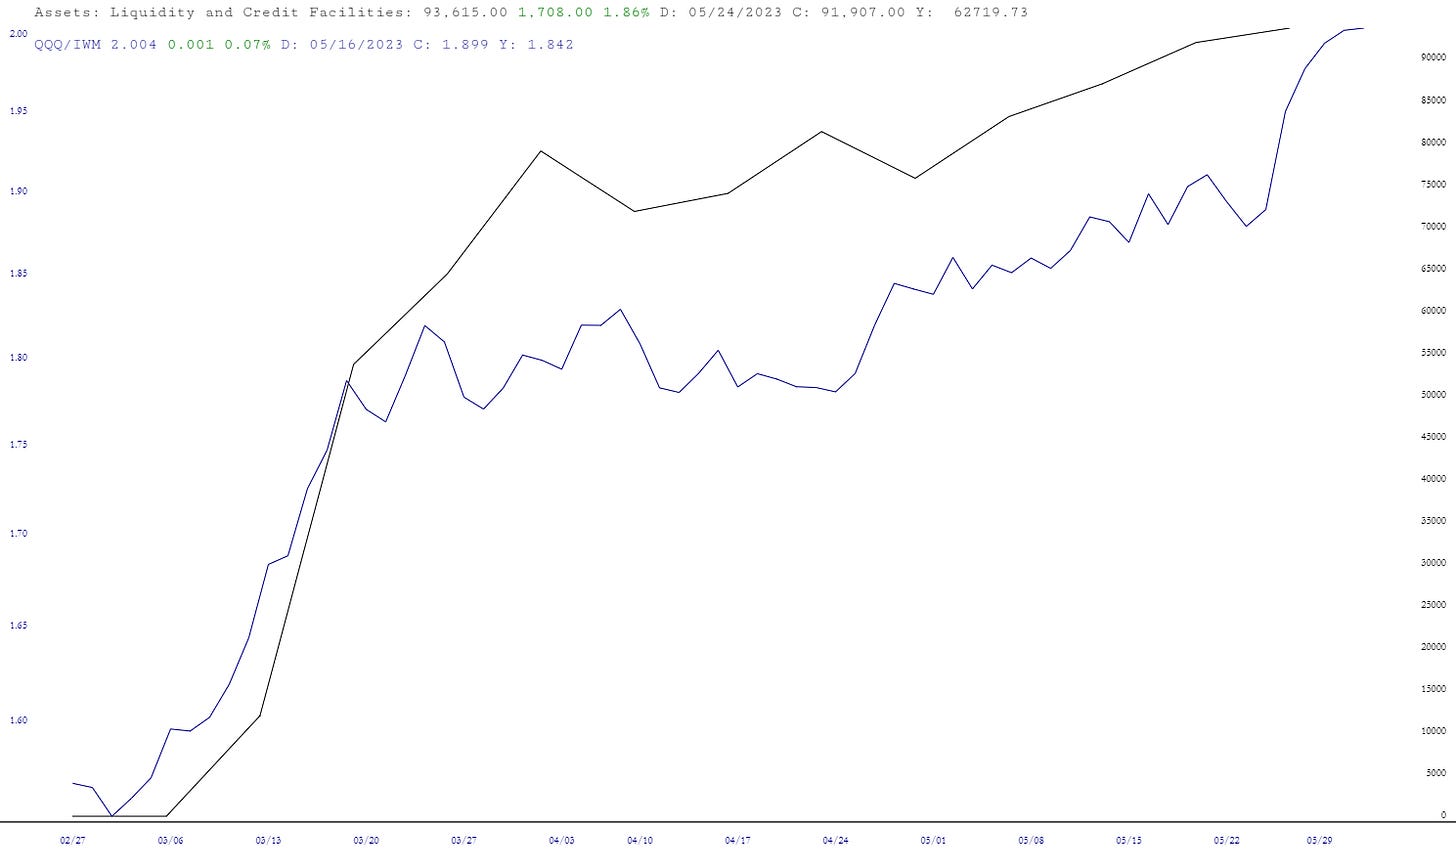
Objectively, it seems hard to believe the Fed’s liquidity facility is ripping the market, but it does correlate perfectly with the Nasdaq-Russell 2000 ratio and the Nasdaq is moving higher. The federal budget deficit and the rundown in the Treasury’s account at the Fed provided more than enough offset for the Fed’s ongoing QT program. I didn’t show it, but if you flip that chart of USG’s deficit upside down, it correlates well with speculative assets.
Long story short, we’re going to get a big test of the liquidity theory coming up when the Treasury starts issuing more debt. A wave of deficit spending will crash up against a Fed that is still selling assets off its balance sheet.
One new variable that could factor in: recession. What if the market suddenly wants treasuries again because of a slowing economy? That would throw off the model because the Treasury can issue as much as it likes into a world still awash in excess money supply. It would also invert the meaning of a rising deficit as tax receipts tumble in a recession. For now though, enjoy the exit liquidity.





Haha haven't heard that song in eons. Great take!