The Black Rabbit Catastrophe of 2023
The Black Rabbit Catastrophe of 2023
The Chinese Zodiac warns of disaster next year

The Chinese zodiac has a 12-year cycle of animals plus 5 elements that make for a 60-year cycle. The coming year is called the water rabbit and also the black rabbit since that color is associated with water. It will run from January 22, 2023 until February 09, 2024.
Here’s a quick summary of the stock market during the past ten rabbits:
The Black Rabbit year of 1903 brought the “Rich Man’s Panic.” A bear market started in 1901 found its final low in November. Dow Hits 'Rich Man Panic' Low Of 1903
United States Steel Corporation was among the hardest hit [in the bear market], falling from $55 to $10. U.S. Rubber shares dropped from $44 to $8, while shares of American Can fell 90 percent.
The Black Rabbit year of 1963 was fine for stocks. The Dow Jones Industrial Average climbed more than 20 percent in the calendar year of 1963. Not everything went well in society though: President Kennedy was assassinated in November.
Counting forward during the post-Bretton Woods era:
The rabbit year of 1975 was bullish for stocks with the 1973-1974 bear market low being made in December of the latter year. Stocks would rally for 21 months, with the DJIA rising more than 80 percent.
In the rabbit year of 1987, stocks crashed 40 percent over 10 trading days in October, with one day down 20 percent from high to low.
The rabbit year of 1999 saw stocks rally more than 30 percent into October before going vertical into the March 2000 top. The Federal Reserve inflated like a madman in the midst of a stock bubble because it feared a possible disaster from the Y2K computer bug. Going by the zodiac calendar, the rabbit year saw the Nasdaq climb 97 percent
In the rabbit year of 2011, the S&P 500 Index gained 2.11 percent. It saw a better than 20 percent correction between April and September though. Gold peaked that year, marking the top in the commodities bull market begun about a decade earlier. During the summer, Europe’s sovereign debt troubles surfaced again and there was fear the U.S. could default during a debt-ceiling battle between Congress and President.
Prior rabbit years of 1915, 1927, 1939 and 1951 saw the DJIA rise 81.66 percent, 28.75 percent, fall 2.92 percent and rise 14.37 percent.
This is all nonsense, right?
I’m of two minds when it comes to the zodiac. I don’t believe in astrology, but I do think cycles are valid. Cherry-picking, confirmation bias and pattern recognition where none is warranted are all valid concerns when not using a more concrete cycle such as weather patterns, or market patterns.
Having said that, let’s look at the accumulated evidence for this 12-year cycle of rabbits. First, the last three rabbits all saw violent market events. Two were major corrections and tops, while one was a bullish melt-up. If you were involved in the financial markets in any capacity, all of these years are instantly memorable for their volatility. There was also the boom in 1915 predicated on expected war spending.
The year 1975 was also notable for its proximity to the bear market of 1973-1974. Similarly, the boom in 1999 followed a massive correction in late summer 1998. The tech-heavy Nasdaq lost 33 percent from its July high to September low.
By my count, there are only 4 boring years of 1927, 1939, 1951 and 1963 for stocks. 1903, 1915, 1975, 1987, 1999, 2011 were all years where markets made huge moves. From this history alone, the correction (thus far) in 2022 and the overall economic and financial situation, the Black Rabbit of 2023 might prove to be another memorable year.
The Bullish Argument
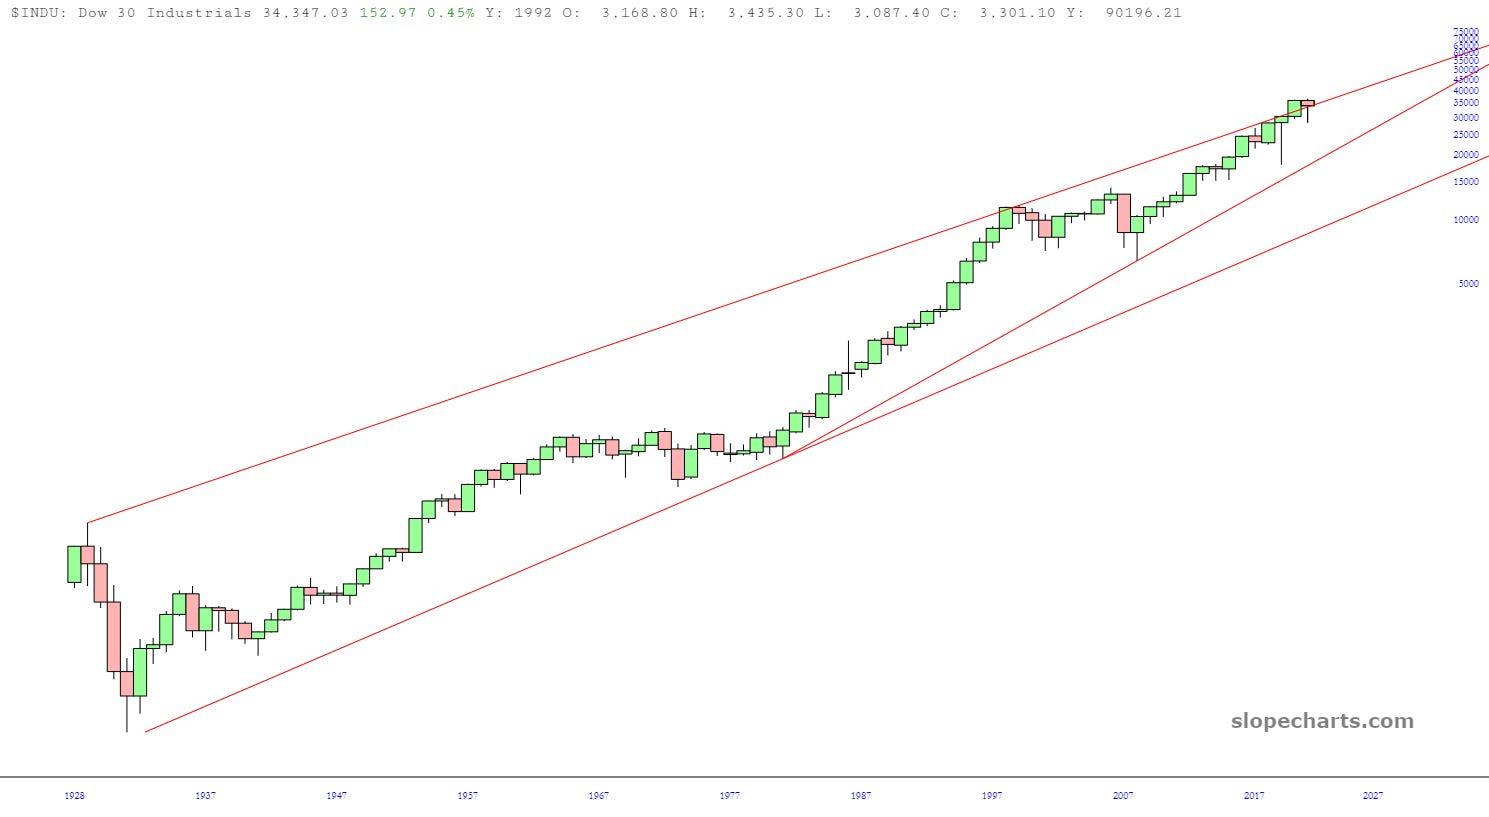
The bullish case for stocks rests on the DJIA. The index is barely down in 2022, with a loss of 5.37 percent. I reject all claims of a bear market in 2022 based on this alone.
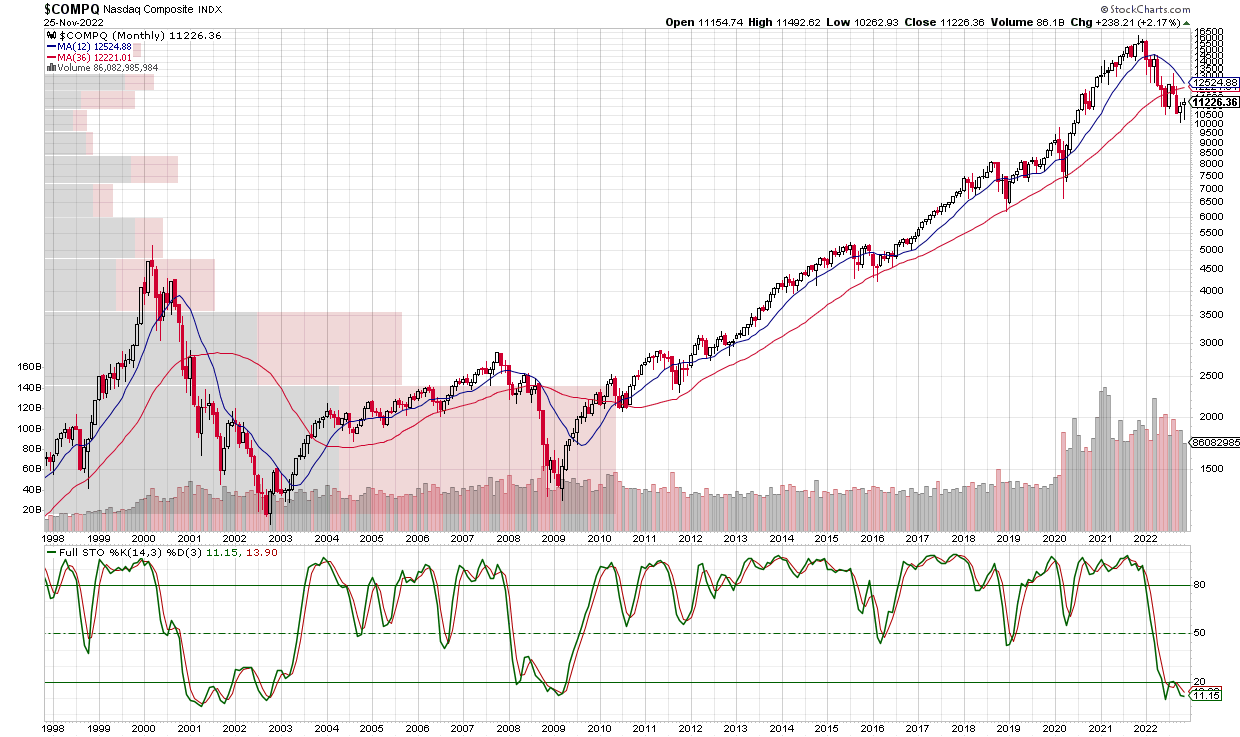
The Nasdaq was the worst of the major indexes this year and it is barely below the 200-week average and barely above the 50-month moving average. The two moving averages are separated by less than 3 percent. The S&P 500 Index and Dow Jones Industrial Average are both in better shape, but all three show the same behavior in the past two bear markets. They all break the 50-month and go far lower before bottoming.
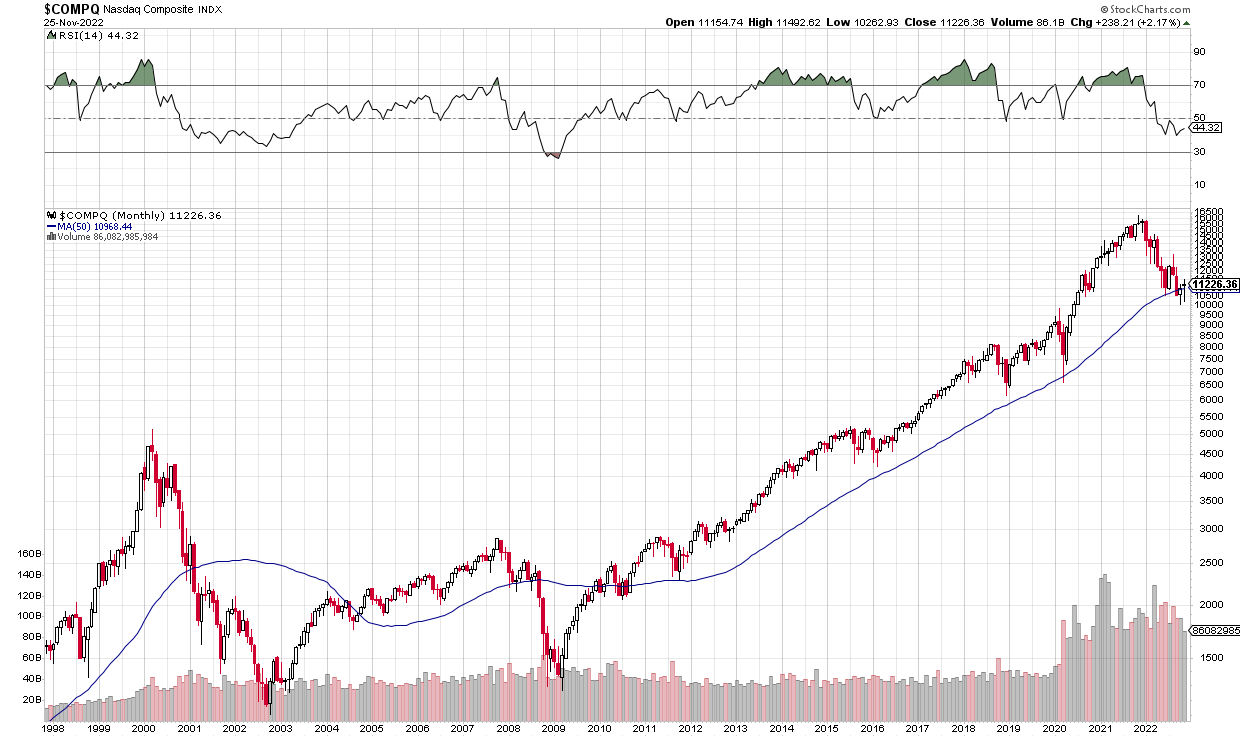
The stochastic indicator looks like 2000 for the Nasdaq.
The Dow looks more like 1975 and since this high-inflation environment better resembles the 1970s, perhaps it is hinting the Federal Reserve is about to lose control.
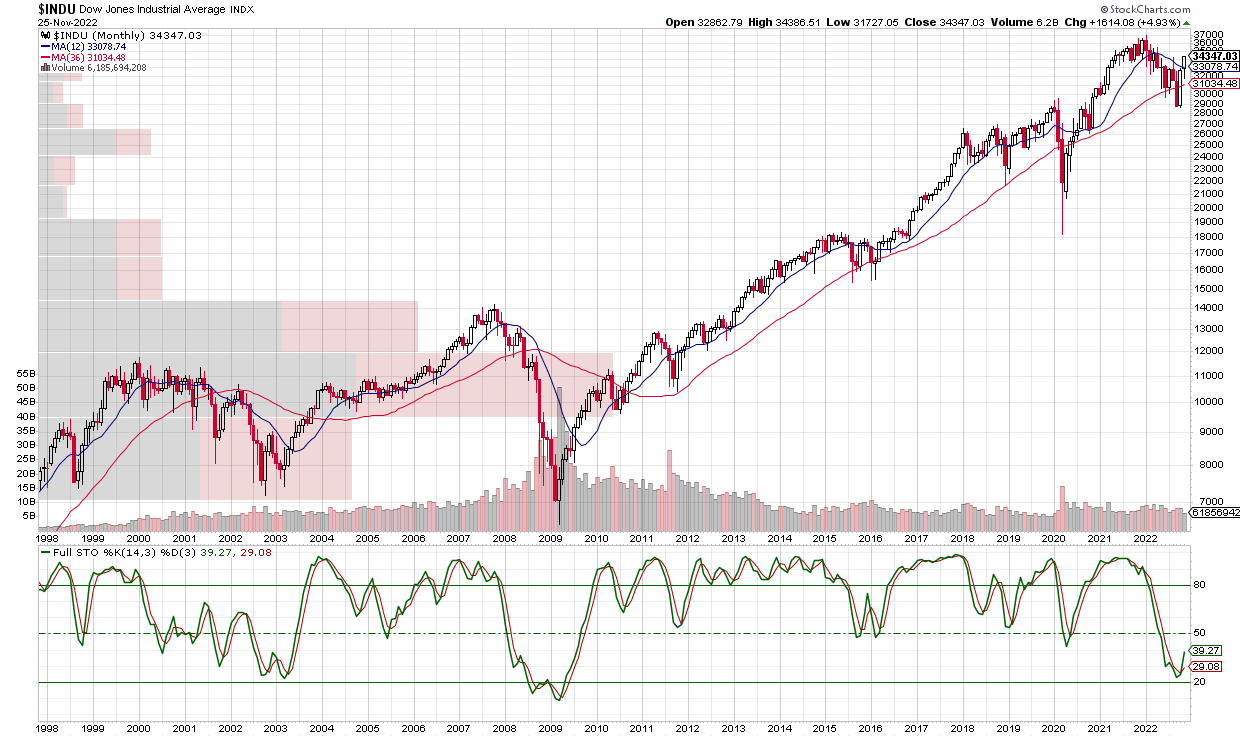
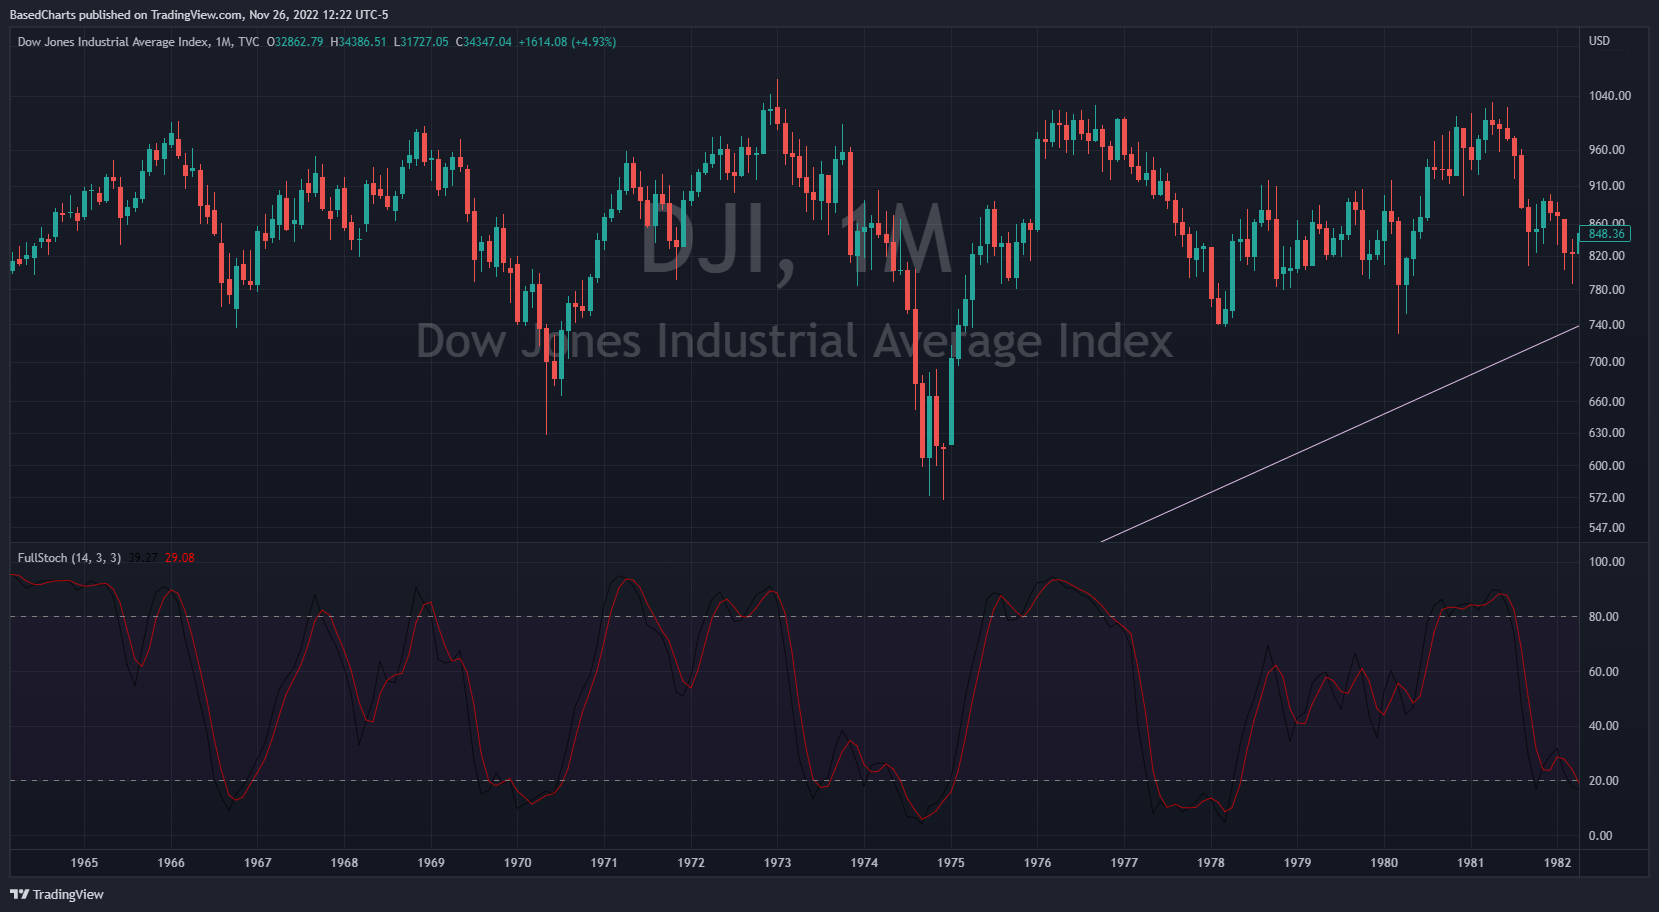
Could 2023 be a melt-up year for stocks? Can you imagine the speculative fever in crypto, stocks, homes and everything if stocks reverse higher? If the Dow Jones Industrial Average runs back to its resistance line for the 2009 bull market, it could rise 30 percent towards the 44,000 level next year.
Although I’m not bullish, I do think volatility is coming. If I’m wrong about the bearish direction for markets, then the next likely interpretation is volatility on the upside. Some subcategories of assets might trade sideways, but general sentiment will be very bullish if stocks rally. The Nasdaq will rip higher and that will propel the DJIA to new all-time highs very quickly (assuming the market doesn’t have the worst drop of 2022 in December). Something along the lines of the 1920s boom meme will be back. Perhaps a Goldilocks scenario where inflation falls and the Fed leaves monetary policy loose unfolds, setting the stage for another massive inflation in asset prices that doesn’t spill into the CPI.
The Bearish Argument
The bearish chart argument is the opposite of the bull. The strength of the DJIA and the major index bounces off the 200-week moving averages shows that this isn’t the “real” bear market yet. They will weaken, break that support level and start behaving like the dark days of the 2000s and 2008 bear markets.
In the bearish view, some assets such as cryptocurrency and speculative tech stocks have been pulverized, but these are the forecasters. Stocks such as Apple and indexes such as the DJIA will eventually be down 50 percent or more from their highs. Instead of big rallies in Bitcoin and ARKK, they fall another 90 percent. Looking at the stochastics, stocks will be jammed in oversold conditions for the next 12-plus months as selling begets selling.
This comports with my bear forecast. I believe the 2000 and 2007 top areas around 1500 will be tested at the low. The down move to this point has only burned off the lockdown bubble. I expected a bear market in 2020 following the breakdown in the U.S. repo market in September 2019, but coronavirus interceded. The bubble that was blown has been burned off in many speculative assets, but the broader stock market is still way above those levels. We’re still going to get the bear market that should have unfolded in 2020.
Chinese Zodiac Interpretation
Now let’s turn to the Chinese zodiac. How does it describe what’s coming in 2032? Catastrophe.
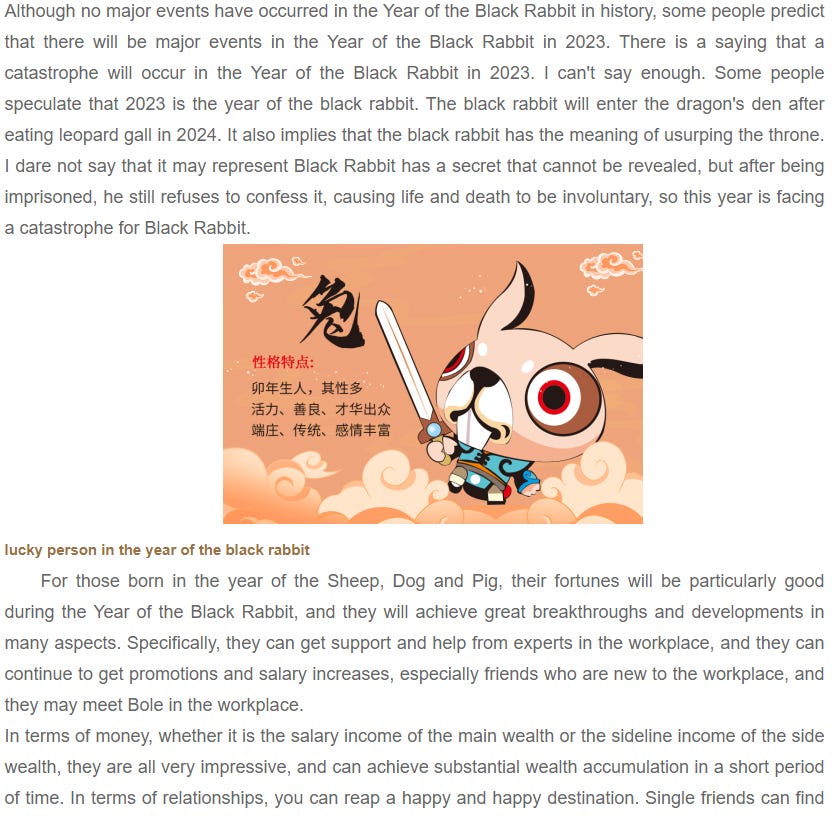
The Year of the Black Rabbit Catastrophe Might Be Real
Black may represent an obvious event, and the little rabbit represents a particularly fast birth and reproduction rate. Walking into the Qinglong Cave, there are obvious signs of invasion.
The way to survive the black rabbit into the blue dragon disaster
As long as everyone is united and courageous, the host will surely be able to live happily in his homeland again! Qinglong will eventually drive away Heitu! ! !
This next article says something similar, but is less superstitious. It says something bad might happen, so be prepared. Save up some money, don’t be very greedy. Basically like a money manager saying they’re “cautiously optimistic” about stocks.
This one says the Little Ice Age will start in 2023, with the USA and Canada hit hardest: 2023年黑兔年大灾难真的假的. It also strays into socionomics, saying people will fight with coworkers, divorces will soar, there will be a general malaise in society.
Conclusion
Whatever you believe about the Chinese zodiac, most interpretations are similar. Note that a couple of these were written in 2021 and therefore aren’t projecting current events into the future. These are the straight reading of the astrology.
I am almost entirely dismissive of astrology because I’m not superstitious. All these interpretations include a lot of individual forecasts that I ignore. That said, our ancestors in all civilized cultures were imparting accrued knowledge through imperfect systems. There’s something to the cycle theory of history and maybe the Chinese zodiac is picking up on predictable cycles within human society.
With financial markets and geopolitics in a precarious state, saying the next year will see big moves in financial markets isn’t a bold prediction. If inflation falls, if Russian and the West achieve peace, then maybe a melt-up in stocks follows. Conversely, if events don’t improve or worsen, it would be disastrous for financial assets that are still priced based on rosy growth, earnings and macro scenarios. If you’ve read the recent posts prior, you’ll know I think the rally is running out of steam here. The zodiac doesn’t give me any increased confidence in my forecast, but would be quite the coincidence if the Black Rabbit forecast proves accurate.
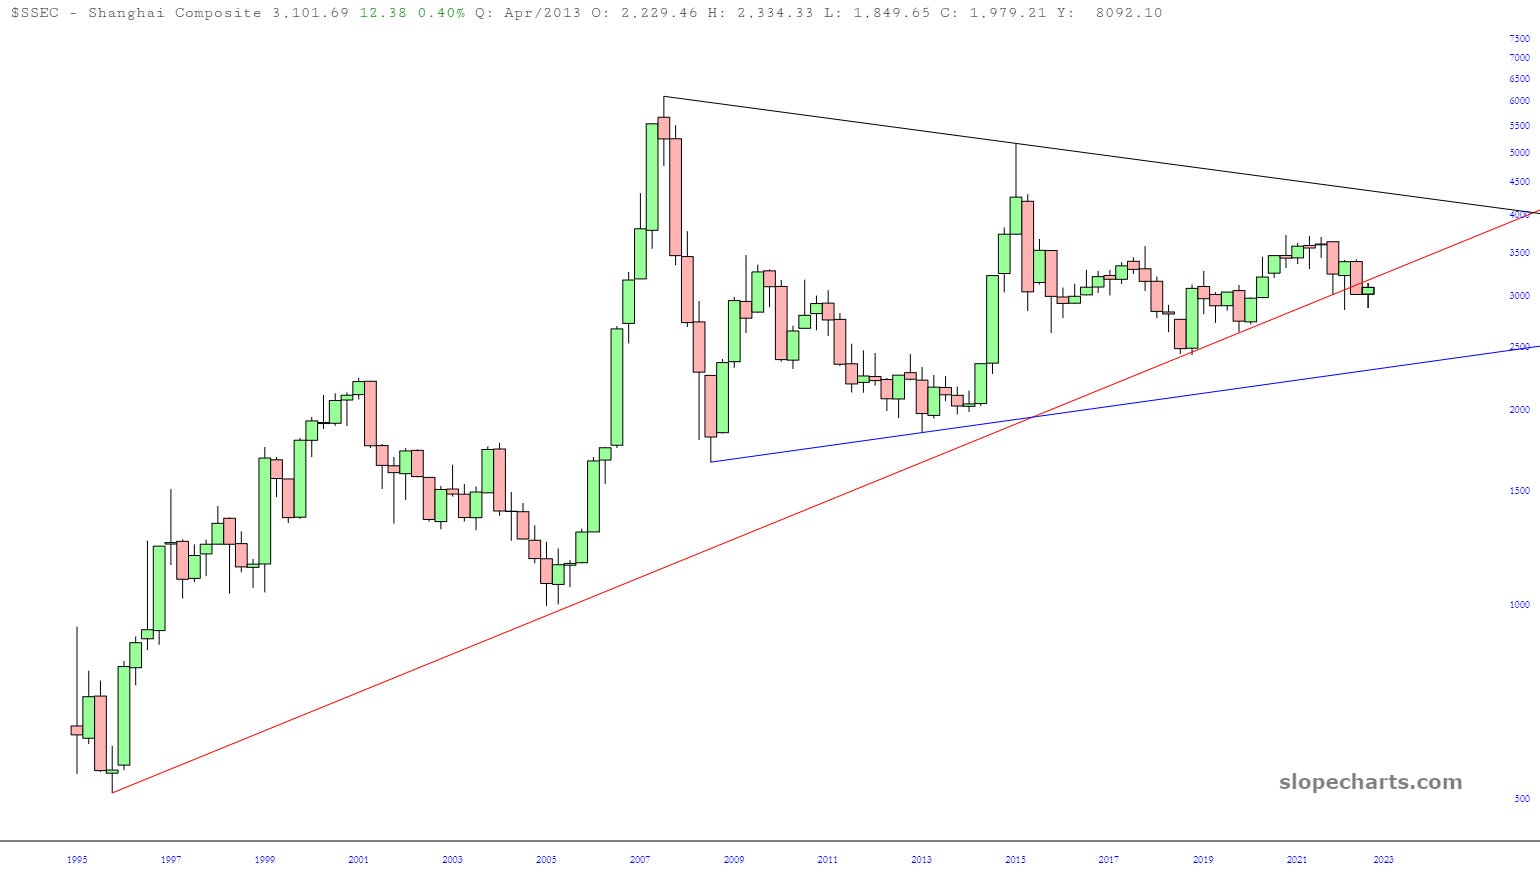
Finally, the eruption of lockdown protests around China, including large ones in Wuhan, hint at the myriad ways in which negative social mood can manifest itself. China’s stock market has gone sideways for 15 years. Economic reform stalled in 2005, massive deflationary credit and housing bubbles (because the money went into the supply side) were blown after 2008, reform stalled further in the 2010s, the capital account was locked down years before the whole country was locked down for a virus that behaves like the flu. Either the CCP knows there’s something very sinister about this virus or lockdowns are cover for economic and financial turmoil.
If this cover is blown by public resistance, maybe the mask comes off in 2023. Perhaps it will be a “Tragic Year” like in 1931. Most economists believed the depression was over, only to see the darkest part of it unfold. Similarly, even stock market bears think China’s reopening will be positive for the economy. They see Chinese demand for commodities reigniting inflation. Few think China’ economy could fall off a cliff or that the yuan could devalue.
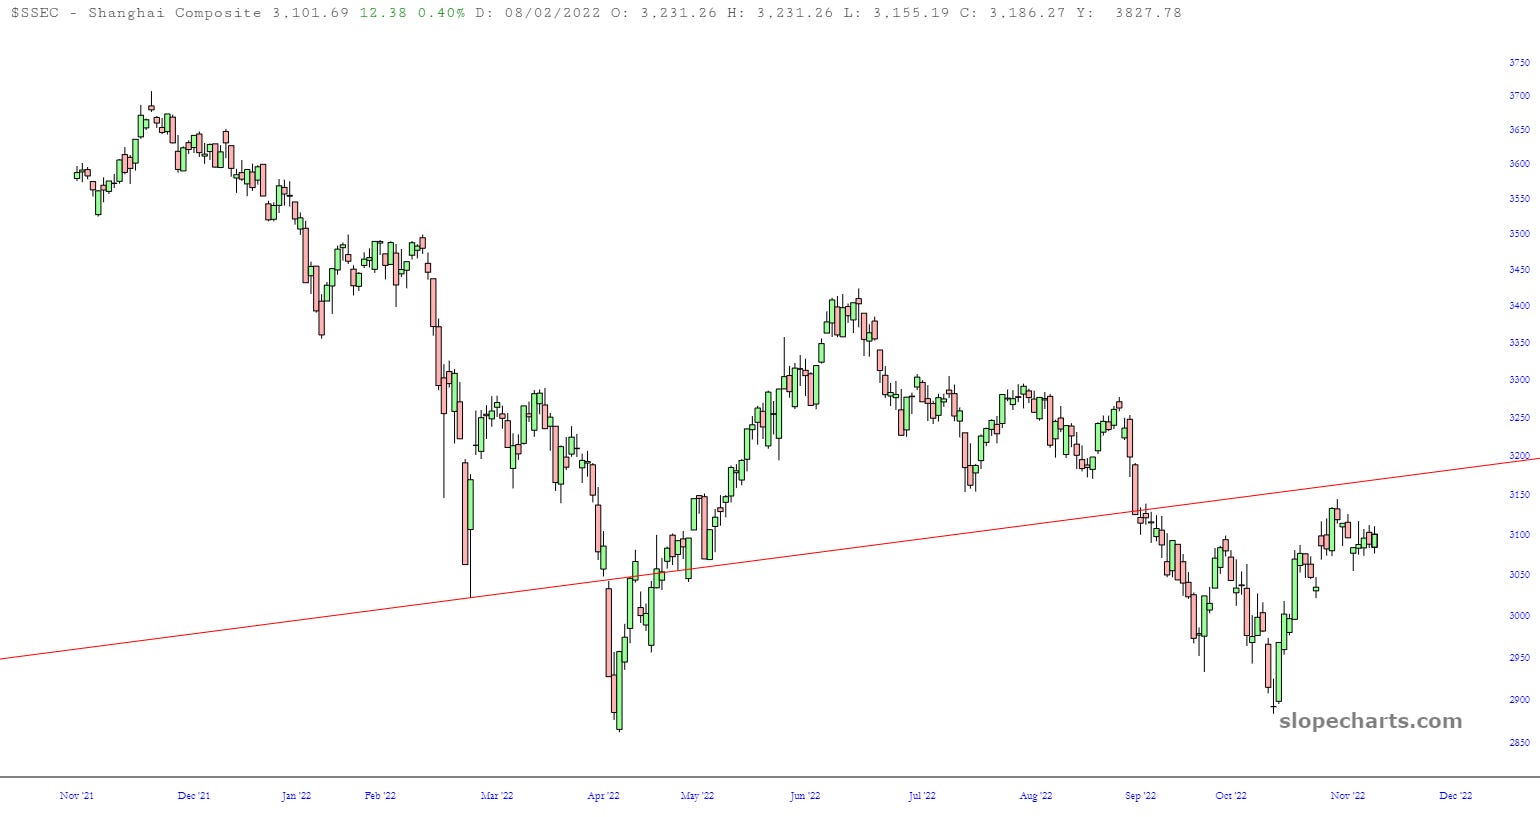
The charts provide a guide. The Shanghai Composite has back-tested support from 1996. Support from the 2008 low is 25-percent below, a breakout above the gray resistance from the 2007 top is 29 percent away. If 2023 is a volatile year, it’s very likely one or the other is tested and broken.