

The Bull and Bear Case for Two Important Assets
The Bull and Bear Case for Two Important Assets
Emerging markets and gold

1. Emerging Markets
I'm very interested in emerging markets as both a bull and a bear.
Here is a post from Michael Burry last week since deleted):
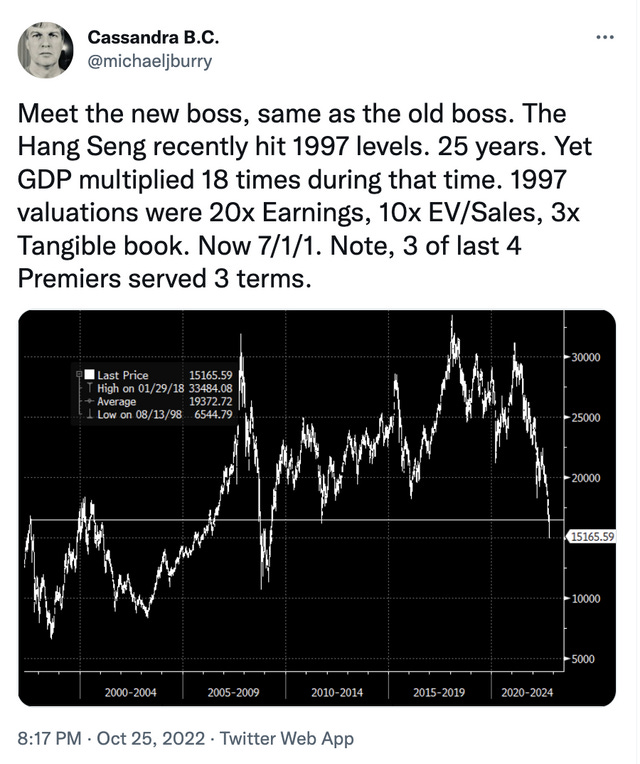
By most measures, emerging markets are cheap. The chart is also compelling for bulls. Emerging markets have gone nowhere since 2007 and are sitting at long-term support.
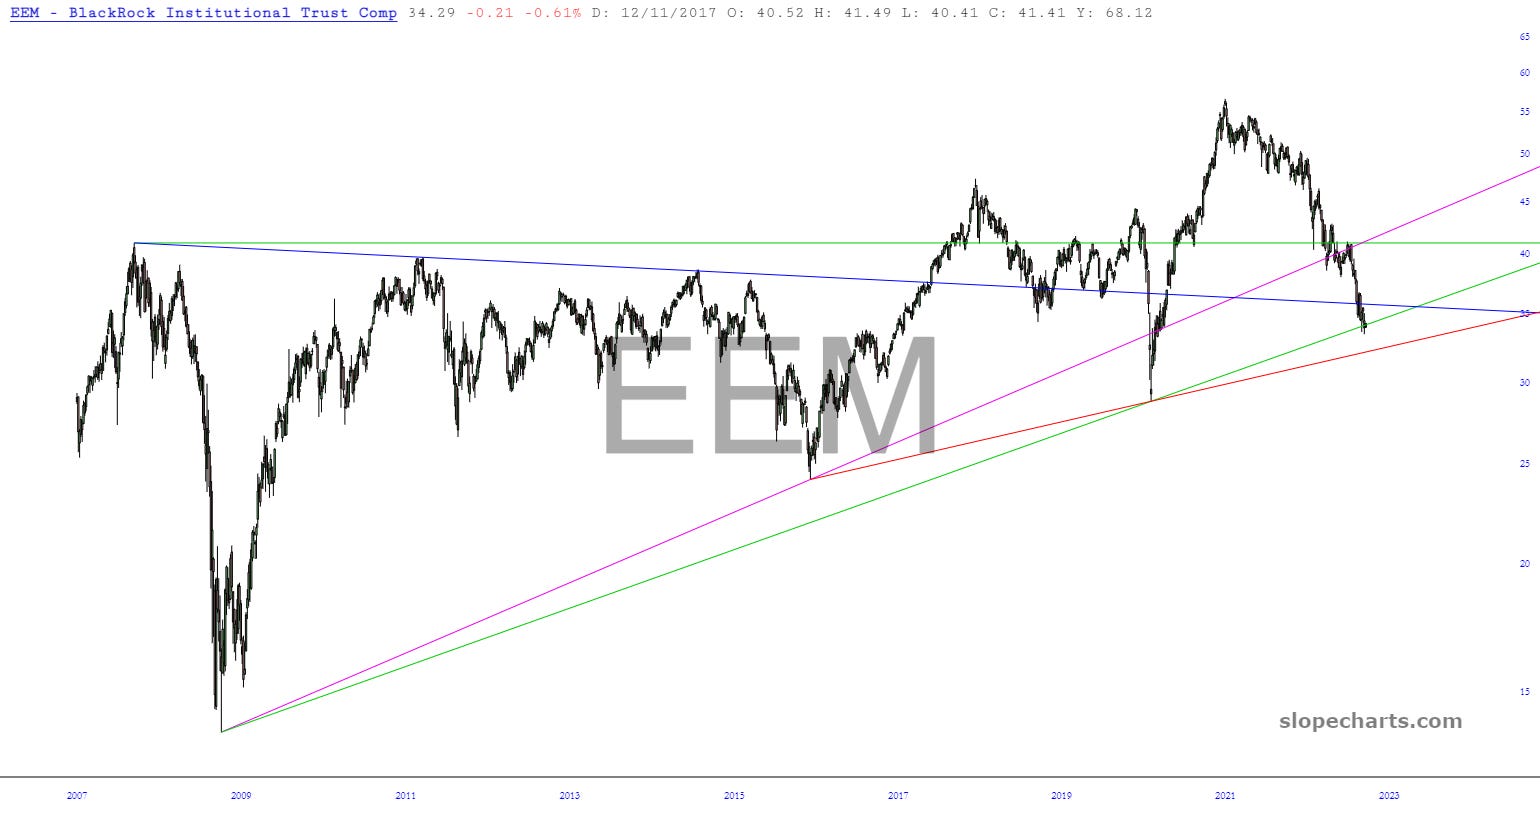
Conversely, the next likely support on a break is 16 percent below Friday's close. Below that, who knows. Conditions are ripe for extreme volatility in currency markets and with assets already cheap, my expectation is any substantial losses in the future will be currency related (China triggering a US trade embargo over Taiwan being the wildcard).
China is emerging markets. It is the largest emerging market, it dominates most emerging markets indexes and funds, it is the largest trading partner with other emerging markets and it drives demand for commodities such as copper that many emerging markets produce. The familiar h-pattern is forming in the Shanghai Composite Index. Next support is 20 percent away.

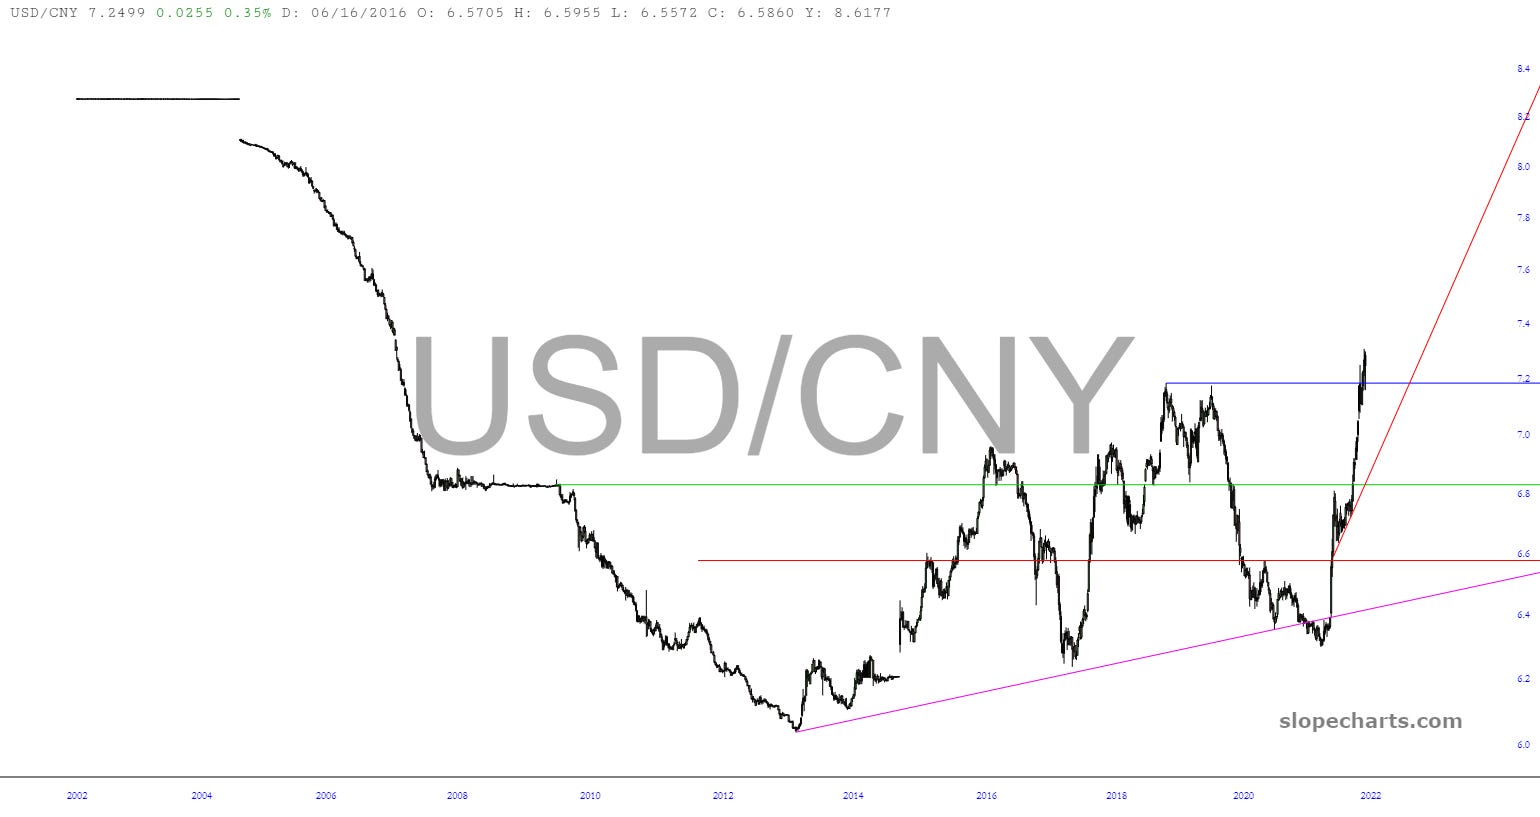
Fundamental analysis of China's financial position tells me USDCNY could decline a lot, but even a very conservative target of USDCNY 8 would rattle global markets. When China let the yuan sink in 2015, other emerging market currencies fared much worse.For about a decade until 2005, China was printing 8.28 yuan for every $1 brought into the country. There is a gap from when they ended this fixed exchange rate and moved to a basket in 2005 that gives a chart-derived agreement on USDCNY 8. Their credit bubble only accelerated post-2008, which is why I think 8 is conservative. Since 2016, taking USD out of China has become very difficult. The country is still locking cities down for coronavirus, they are not renewing passports for Chinese citizens, imports have collapsed, but they've also been pushing exports as high as possible. It smells like a dollar shortage to me. (
Back in 2008, iShares China Large Cap (FXI) bottomed in October and EEM in November. They dipped in March 2009, but made higher lows. If you believe that commodities will outperform stocks in the next 5 to 10 years, then it makes sense for emerging markets to bottom first again. Emerging markets’ main risk is from a China collapse or currency devaluation. Devaluation would be the all clear signal to make long-term investments in emerging markets because their currencies will have bottomed versus USD.
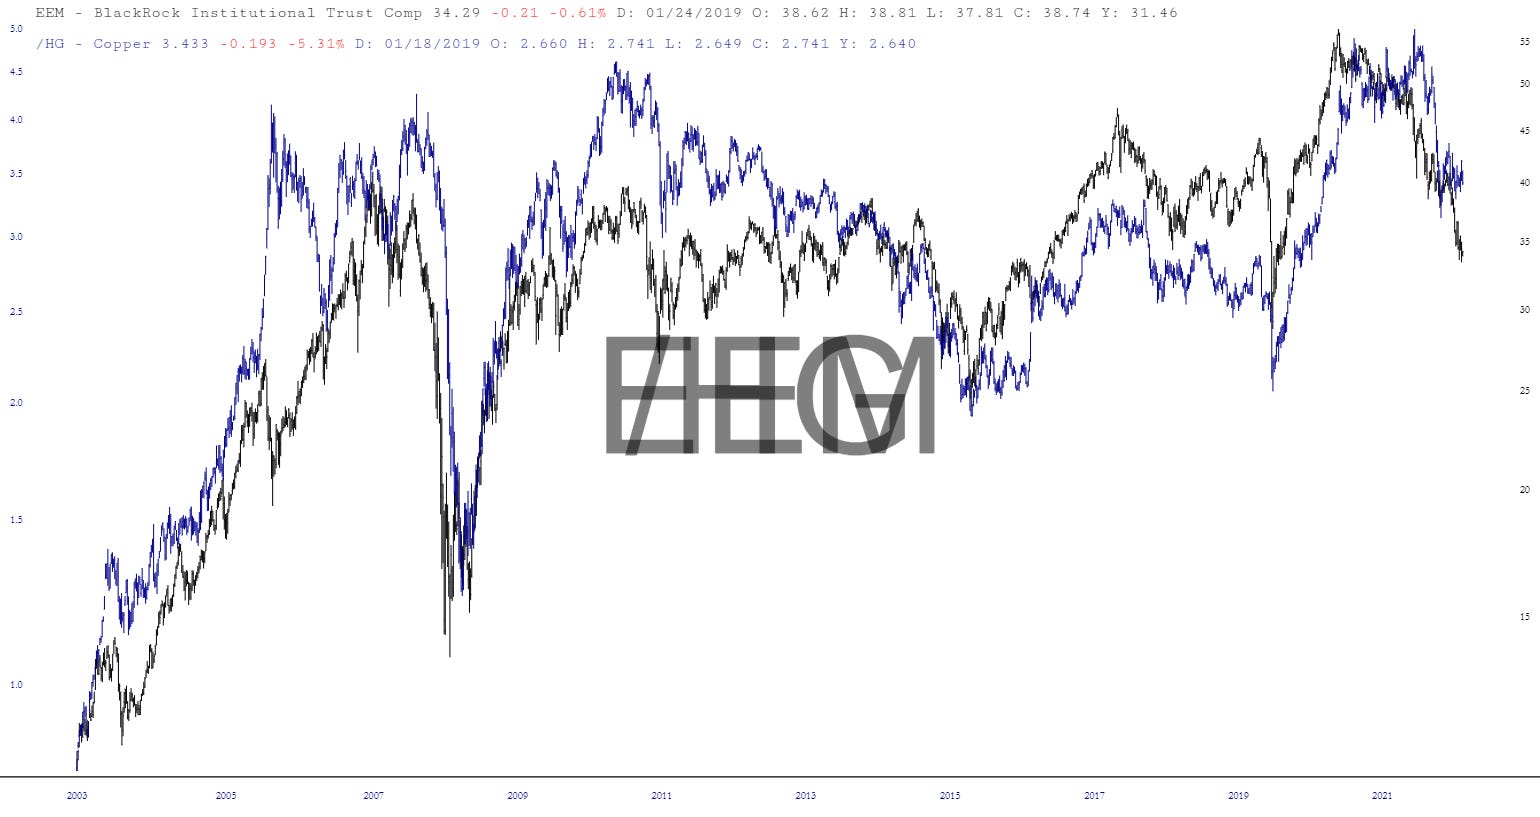
Finally, overlay commodities. Energy is the best performing sector in the U.S., but emerging markets are near their lows? Something doesn't compute and it is currency risk.
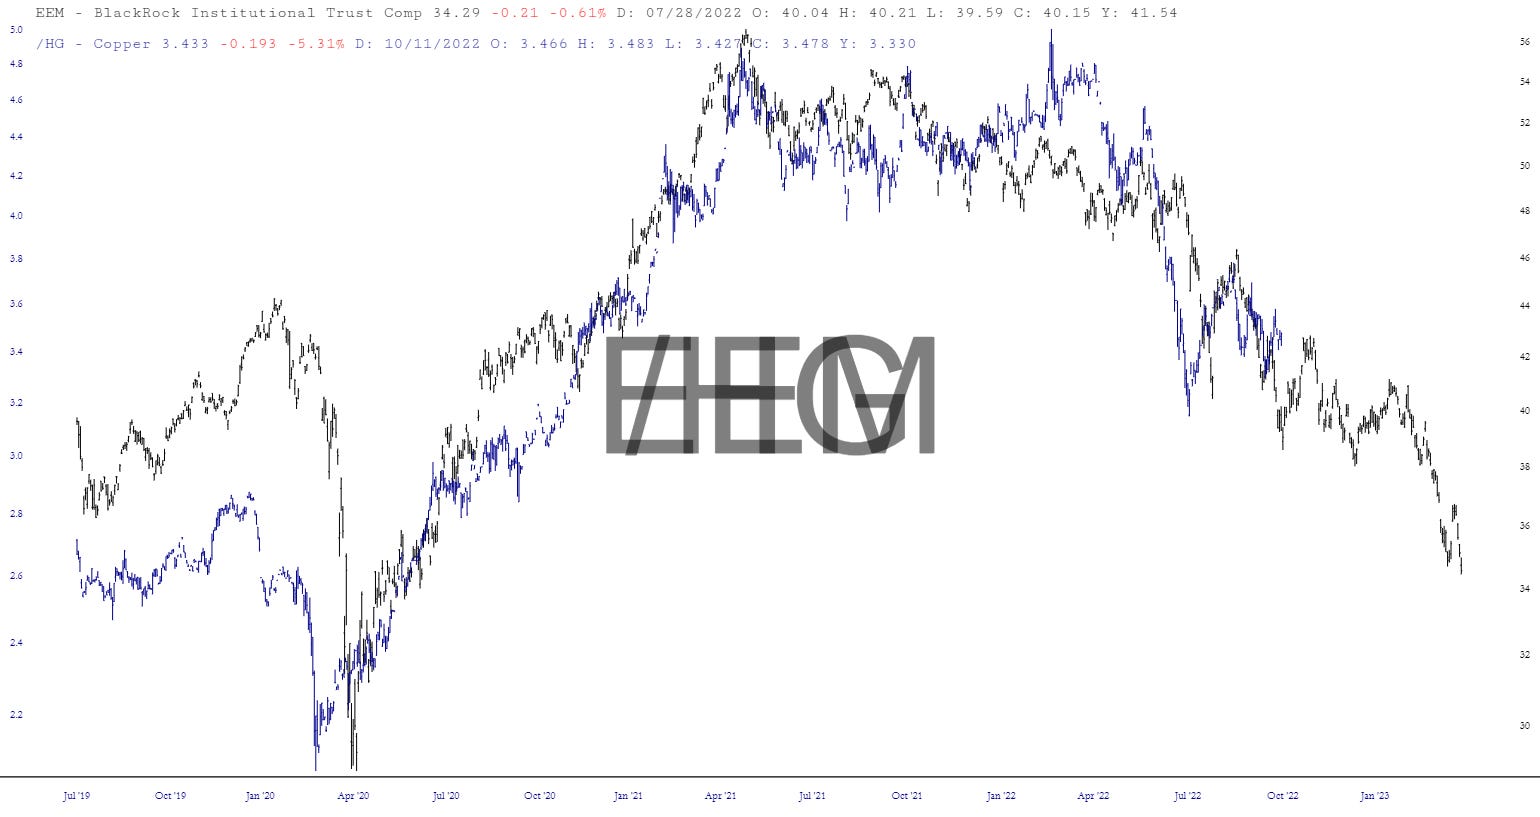
Trade concept: emerging markets and energy/commodities trends will eventually converge. The trick of course, is which one is the leader? Here is copper and EEM layered.
My view is that copper, gold and oil all look like they did in 2008, 2011, 2014 and 2018. That's my bias, but as I've laid out, we have emerging markets as a helpful asset thatt can provide confirmation or denial. There's nothing wrong with being wrong in the markets, the question is whether you adjust your view when the market dictates it. Full disclosure: I have $34 strike EEM puts for November. EEM lagging the past two weeks gives me crashy thoughts.
Bonus chart: EEM vs Copper with their 2021 tops synched. Maybe the better trade is short copper if EEM falls?
2. Gold
Maybe the worst investment in the world (if we're talking about gold miners) and simultaneously one of the best signaling assets in the world. Here's a layered chart of gold and real interest rates as calculated by the Cleveland Fed.
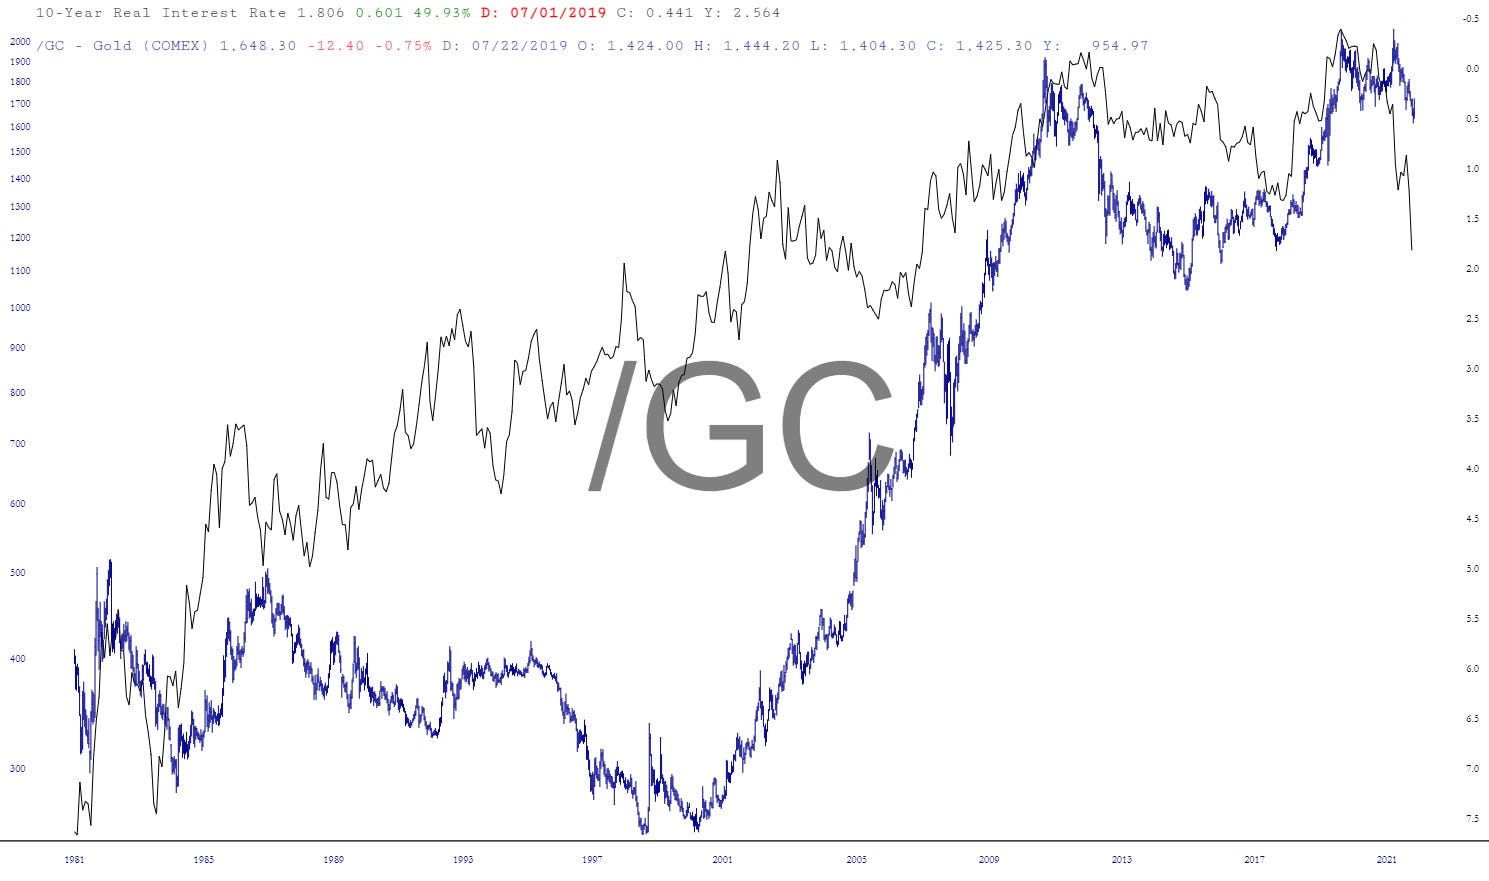

If inflation falls faster than the Federal Reserve cuts rates, real interest rates will rise from here. Stop worrying about the pause and pivot, and ask yourself: do you think real rates will rise or not? Gold should fall if real rates rise.
Add another piece of information: the gold chart. I see both a bear and bull resolution.
One is an analog to 2011. Gold made a peak in 2011 and a lower high in 2012 before imploding in 2013 as hyperinflation predictions went up in smoke. Once it broke horizontal support, it quickly gave way.
This time, gold peaked in August 2020 and made a lower high in 2022, and is now beneath the corollary horizontal. Unlike then, it has tried a bounce and peeked above that support/resistance line. Last time the top took less than 600 days to form; this one runs more than 800 days.

The opposite read is the giant bullish base. Gold has uptrend support from 2008 that sits around $1460 today. This bullish interpretation doesn't help much if gold breaks lower, at least until gold approaches that support. Shorter-term, I’m interested in a bullish move that invalidates the analog, particularly if it moves opposite from real interest rates. That would be a warning that real interest rates might be heading lower again. In context with other assets such as copper, oil and the U.S. dollar, it will help clarify longer-term trends.
Trade idea: Short GLD. In April 2013, gold fell more than $200 in two days. A bear move should be both imminent and substantial if it is coming.
If instead gold rallies, then I'll filter that back through my macro read. Rising gold signals falling real interest rates, rising inflation, commodities strength down the road, emerging markets should lead...
Any guesses as to why Burry deleted that twat?
Martin Armstrong claims inflation coincides with rising interest rates. https://www.armstrongeconomics.com/uncategorized/inflation-will-begin-with-higher-interest-rates/ . Any thoughts?