

Clown World Cracks Up

In 1931, everyone thought the depression was over. Green shoots and all. Then Kreditanstalt goes bust in May. In Murray Rothbard’s America’s Great Depression, Chapter 10 is titled: 1931-“The Tragic Year.”
I’ve seen it credibly argued that sell in May (and buy in October or November) comes from agricultural economies. Farmers borrow to plant in the spring. By May, the credit boom is complete. Then comes the lean period into the harvest. If the harvest is bad, debts will go bust. There’s your September and October weakness. USG’s budget calendar still runs from October to September. In modern times, March has been thrown into the mix, maybe because of modern monetary dynamics or because China pumps their still centrally-planned economy at the start of the year. The why isn’t terribly important, as is the fact that these seasonal windows seem to be points where major market turns can begin.
If the market cannot make a new high and enters a serious or lengthy downturn, in hindsight it’ll be another March top. The analog with March 2000 will gain currency. For the moment the market doesn’t believe it, but it’s worth considering that analog. In April and May 2000, after the Nasdaq had plummeted 35 percent, bulls kept right on buying the dip. The S&P 500 Index wouldn’t top until late summer that year.
Castles in the Sky
Tesla spiked overnight on fairy dust. It is sitting right at a gap in pre-market. The next level up is $186. Going short right here at the open doesn’t look like a terrible trade. Thanks to earnings being done, volatility is down and the entry is far higher.

Meta is on deck tonight. It’s about 28 percent up to the $630 area where resistance lies. That’s my peak target for a Clown World Crack Up. Let’s see how Tesla trades today though. How long can magic pixie dust forestall reality?

Yield
The 2s10s curve continues tracing out a bearish-for-stocks base. The chart is loosely an inverse of the stock market. Higher means lower for stocks over time. I repeat again: unless this time really is different, the steepening portion of this move tends to be violent with the stock market top will be in hindsight.
I can’t say March was the tippity-top because something like that dip into March, which fueled new highs, is always possible. If this chart instead moves into liftoff, the 2009-2024 bull market is over.
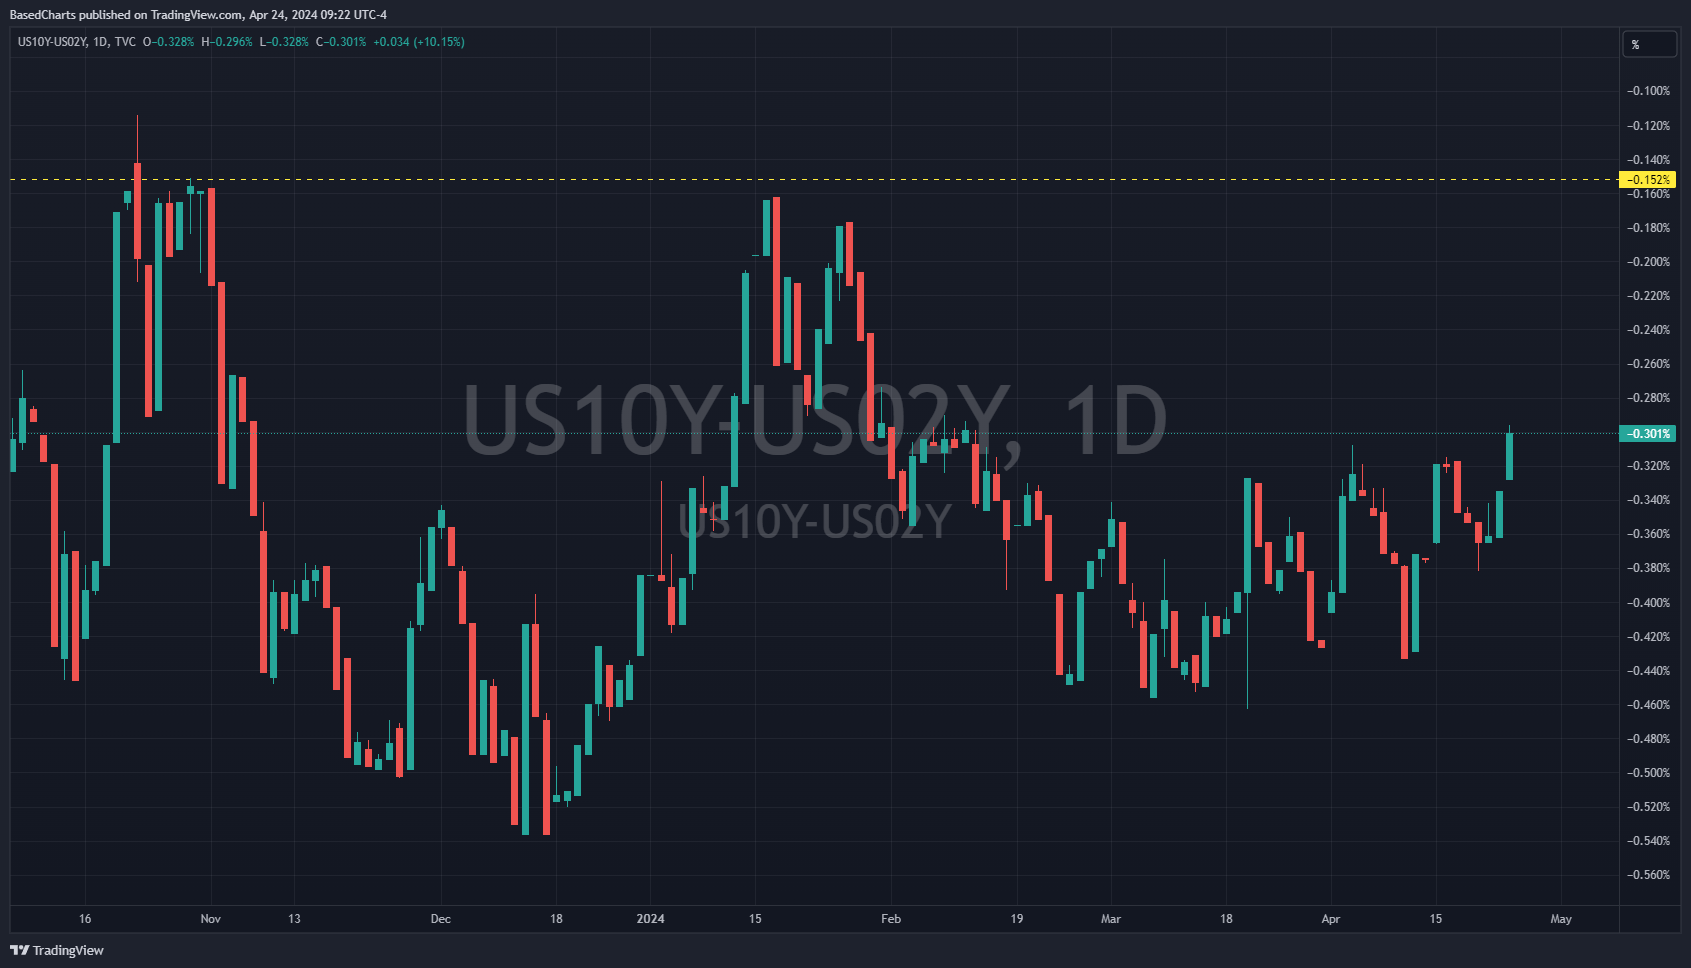
Fun fact. A trip to the October lows for ZN, the 10-year Treasury bond futures, is equivalent to a more-than 40 bps rise in the 10-year yield. The 2-year Treasury yield tends to move ahead of the Federal Reserve funds rate.

If the bond market pukes and tests October’s low, and the 2-year doesn’t move much because that market thinks a rate hike isn’t coming anytime soon, the2s10s spread will surge above zero. Chart-wise, the steepening could be very close at hand.
Speaking of Fed funds, the futures contract for December is sitting below the October 2023 lows.

Krakatoa Spewing Ash
Frequency and Magnitude of Quakes Increasing
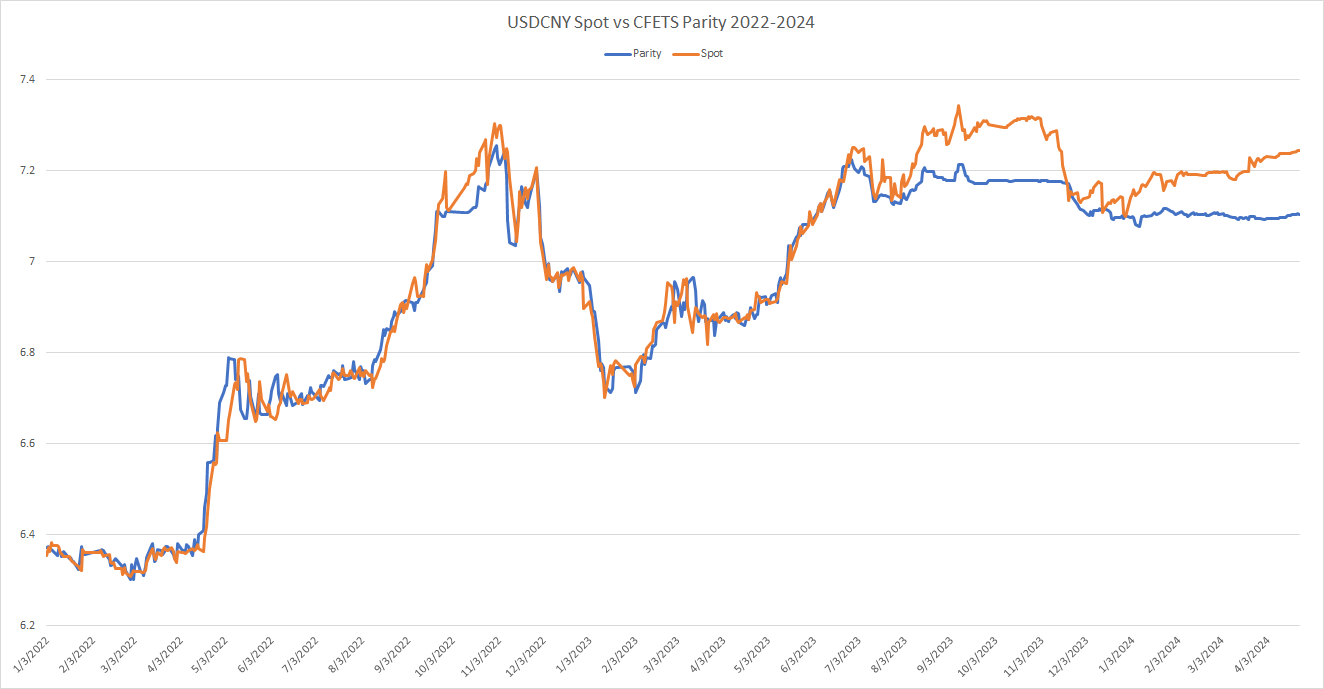
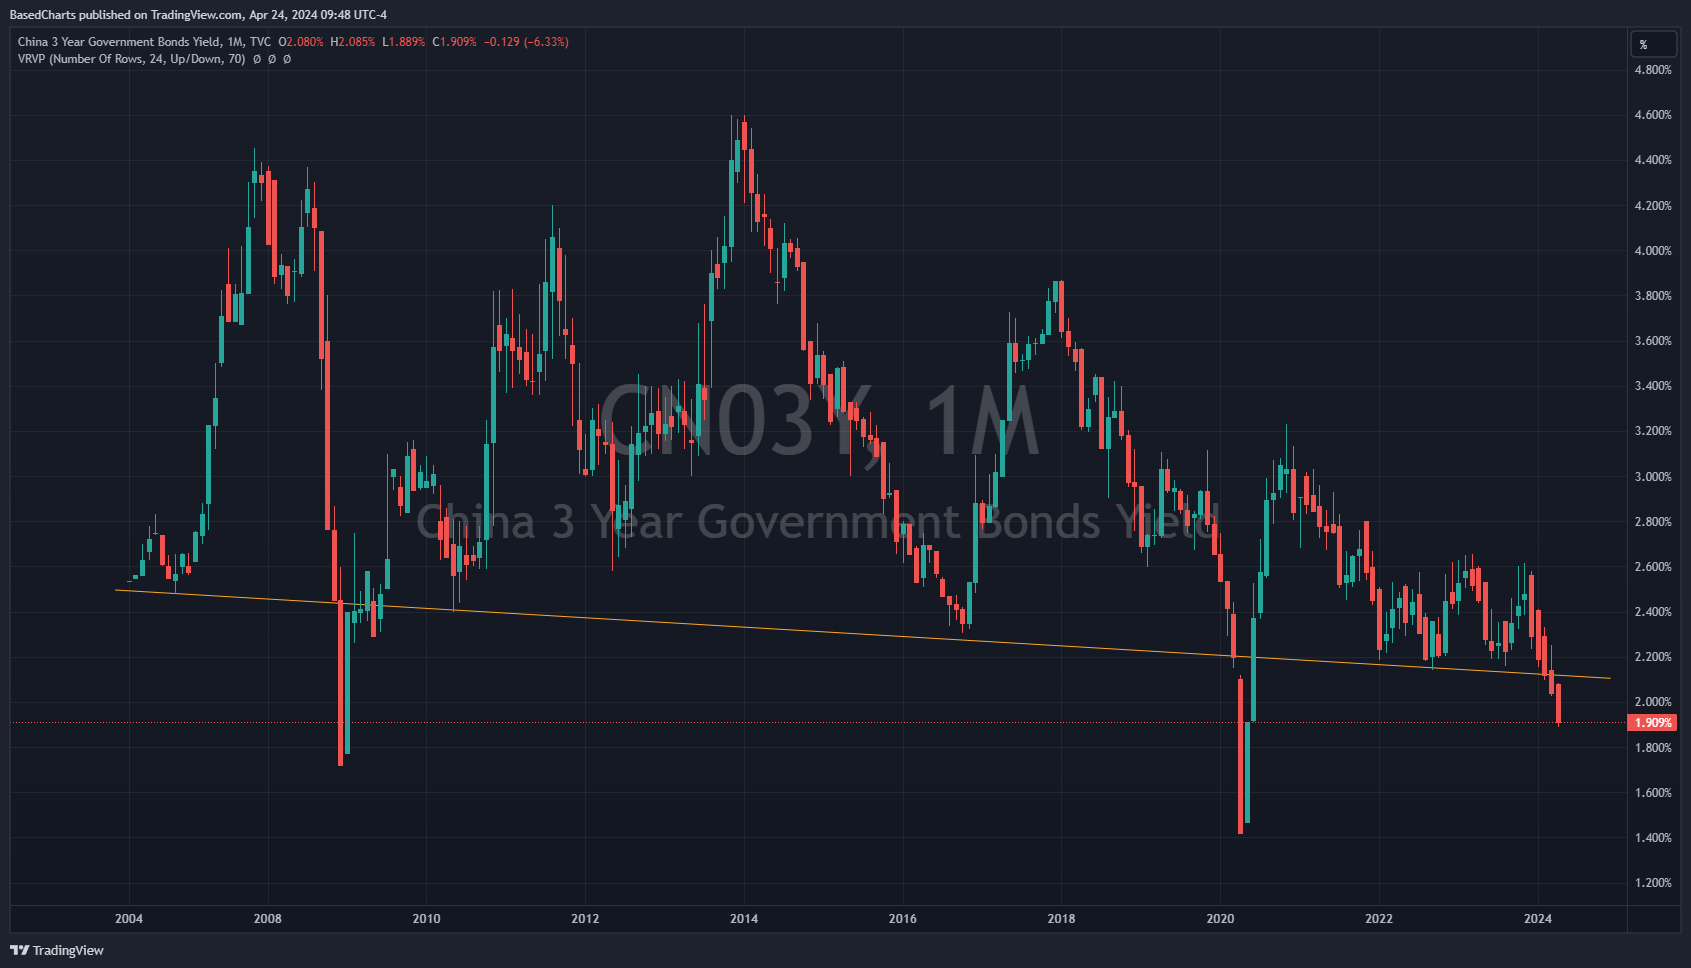
I referred to levels in won, yuan and yen as the Krakatoa line. A move through that line has historically been huge. Won and yen went beyond, but yuan has not. The spread between the yuan spot rate and its central parity rate set by the China Foreign Exchange Trading System (CFETS) is at a new high. I also showed that China’s treasury bond yields went through a similar support line, below which yields have typically plunged into the final leg of a bear market or global recession.

I don’t see much room for nuance here. In the very short term, anything is possible— but I’m not a day trader. A crack-up higher on positive earnings (real or interpreted) Either the stock market is correctly anticipating bullish turns in economic fundamentals or it is winding its way to the quick, brutal correction.